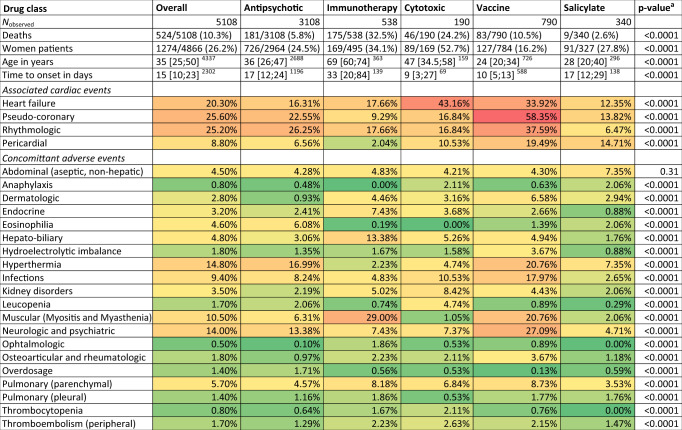
Table 2.
Cases descriptions, by drug class, with heatmap of associated adverse drug reactions (green to red, least to most associated).
Detail of adverse events categorization is available as Supplementary Data. One case may be related to several drug classes. Overall calculations were performed on the cases associated with the 62 retained drugs detailed in the Methods section. Continuous data are presented as median [interquartile range]available data, categorical data as number/available data (proportion).
aIntergroup comparisons are using χ2 for categorical variables and Kruskal–Wallis tests for continuous variables.

