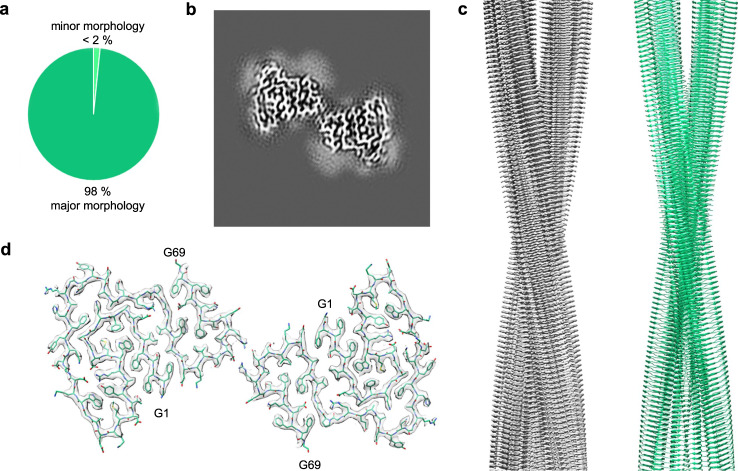
Fig. 3. Cryo-EM structure of the major fibril morphology of the seeded in vitro fibrils.
(a) Relative abundance of the major (deep green) and minor fibril morphology (light green) in the cryo-EM data set (3450 fibrils evaluated). (b) 5.2 Å thick slice of the reconstructed density of the major morphology. (c) Side view of the reconstructed 3D map (left, grey) of the molecular model (right, light green). (d) Cross-sectional view of one molecular layer of the reconstructed density (grey), superimposed with the molecular model (light green).

