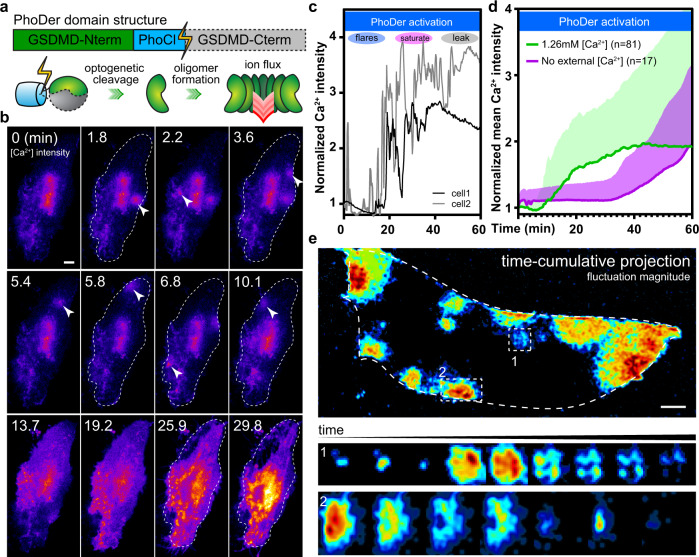
Fig. 1. Optogenetic GSDMD pore activation in live cells shows transient local calcium flares.
a The domain structure and scheme for the optogenetically activatable GSDMD, PhoDer. C-terminal autoinhibition is cleaved after blue light exposure, liberating the N-terminal pore domain for membrane insertion. b Representative calcium biosensing images showing the activation of PhoDer in HeLa cells (n = 81) induced repeated calcium flares (arrowheads); dashed outlines in each panel indicate the outline of the single cell. c Intracellular calcium progression in representative cells over 1 h optogenetic activation time course could be categorized into the flare, saturation, and leakage phases. d Whole-cell average calcium showed the PhoDer-induced accumulation of intracellular calcium; line: mean value, shaded region: standard deviation. Control cells where PhoDer was activated without extracellular calcium did not show such an increase. e Fluctuation analysis yielded high contrast images of flares; dashed curved outline shows the extent of the single cell. Top: time-projection shows the history of multiple flares within the same cell. Two are highlighted by dashed squares. Middle/bottom: representative evolution of two flares, where the pore opens, shuts, reopens, and finally closes again. The calcium current in each time point centers on approximately the same cellular locale. Scale bar: 10 µm.

