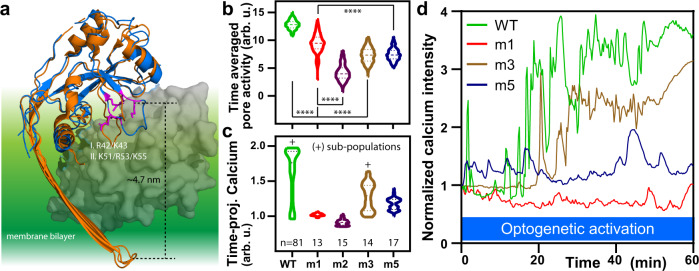
Fig. 4. Mutants at two putative GSDMD phosphoinositide interaction sites alter the optogenetically-activated pore dynamics in living cells.
a Schematic for selection of putative phosphoinositide interaction site. mGSDMA3 structure (PDB: 6CB8, orange) was aligned with the partial structure of the N-terminal domain of hGSDMD (PDB: 6N9O, blue) and positively charged residues (magenta) are selected due to their location in two regions ~5 nm from the edge of the bilayer and burial by the autoinhibitory C-terminal (gray). Significant changes in b pore activity and c time-projected average calcium response were generated by altering the charge or hydrogen bond potential at the two indicated sites. Mutations were made in PhoDer at the corresponding GSDMD N-terminal sites. Mutant labels: m1: K51Q/K55Q; m2: K51E/K55E; m3: R42Q/K43Q; and m5: R42Q/K43Q/K51Q/K55Q. The + sign was used to denote two subpopulations that in time-projected terms indicated substantial calcium saturation. N numbers for each mutant is marked below the violin plots and applies to both (b) and (c). d Representative calcium response curve for mutants: m1 (overall inhibited calcium response); m3 (reduced flares but retained calcium saturation); and m5 (retained flares but reduced calcium saturation). Statistical significance was reported from two-way ANOVA with Tukey’s multiple comparisons, ****p < 0.0001.

