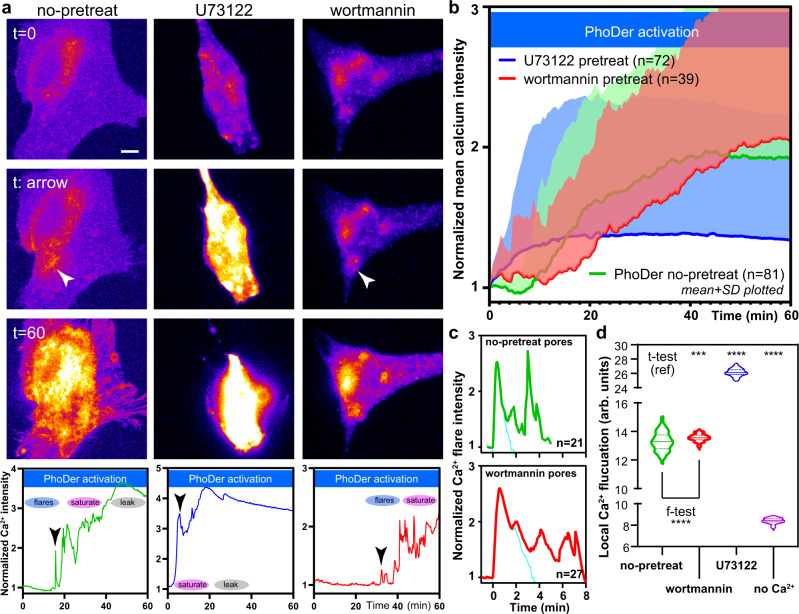
Fig. 5. Inhibition of phosphoinositide pathway in live cells modulates GSDMD pore dynamics.
a Representative images and time course plots showing the effects of PLC and PI3K inhibitors on GSDMD pore functions. Left column: no pretreatment; middle column: 10 min 10 µM U73122 (PLC inhibitor); right column: 10 min 10 µM wortmannin (PI3K inhibitor). Scale bar: 10 µm. b Whole-cell average calcium levels over many cells support the results from single cell responses. The color scheme follows green: no pretreatment; blue: pretreated with U73122; and red: pretreated with wortmannin. Line: mean value; shaded: standard deviation (SD). c Changes in single calcium flare kinetics with or without pretreatment of wortmannin, which significantly slowed-down pore dynamics by a factor of 2. Cyan lines in each panel represent the flare signals subjected to the cumulative inhibitory model fit reported. d Pixel-wise calcium fluctuation show pore dynamics changes with phosphoinositide modulation. For panel (d), statistical significance was reported from individual paired f- and t-tests with two-tailed Welch’s correction; “ref” represents the reference, ***p = 0.0003 (no-pretreat vs. wortmannin); ****p < 0.0001 (no-pretreat vs. U73122 and no-Ca2+).

