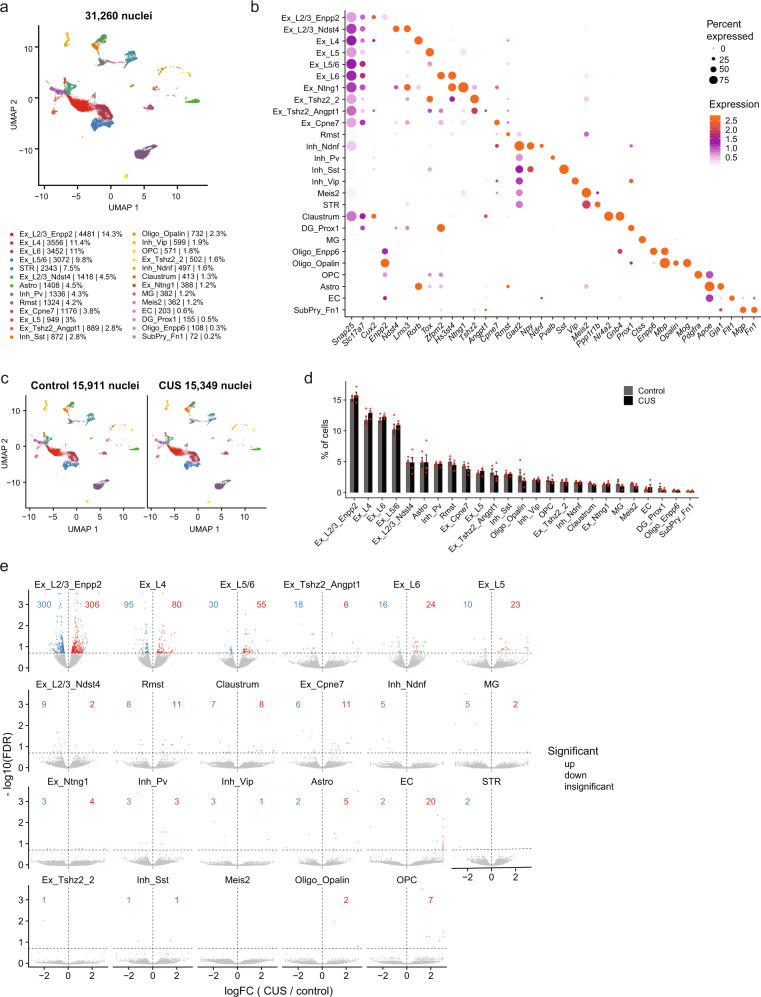
Fig. 3. Identification of CUS-driven cortical cell type-specific gene expression changes using single-nucleus RNA-sequencing.
a Visualization of UMAP plot displaying 26 clusters segregated from all 31,260 nuclei isolated from adult control and CUS mouse cortices (n = 8 mice). Ex, excitatory neurons; Inh, inhibitory neurons; Astro, astrocytes; OPC, oligodendrocyte precursor cells; Oligo, oligodendrocytes; MG, microglia; EC, endothelial cells. b Bubble chart showing expression of cell type-specific marker genes for each cortical cell cluster. c UMAP plots depicting clusters identified from control (15,911 nuclei) and CUS nuclei (15,349 nuclei). d Percentage of control and CUS nuclei for every cortical cluster (n = 4 each group). e Volcano plots of differentially expressed genes between control and CUS cortical nuclei (FDR < 0.2). Upregulated genes are shown in red, downregulated genes are displayed in blue, and insignificant genes are shown in gray. Error bars represent s.e.m.

