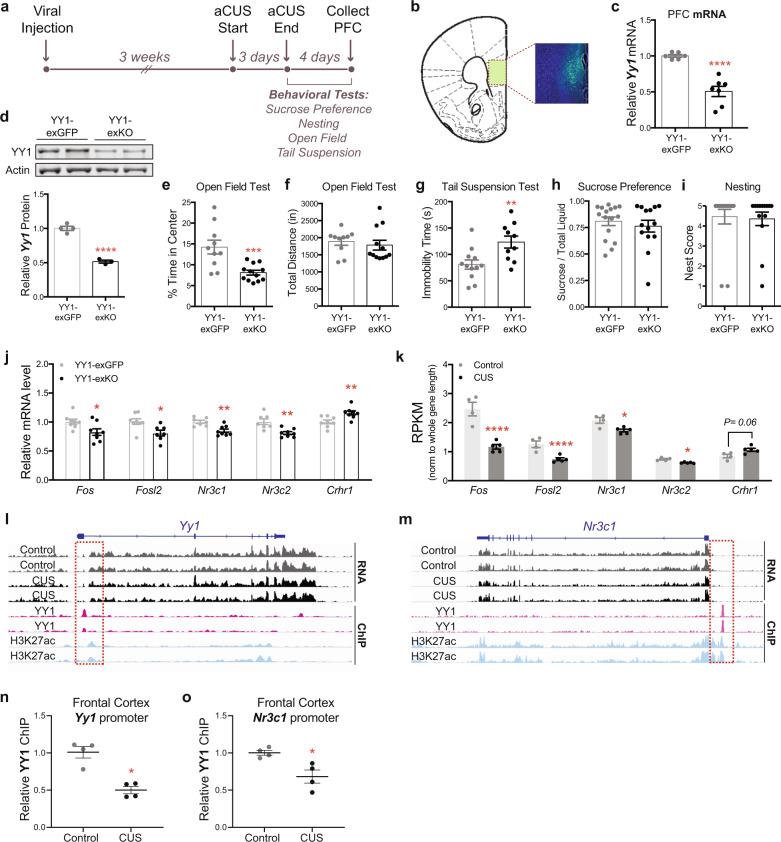
Fig. 5. Selective genetic deletion of Yy1 in PFC excitatory neurons enhances stress vulnerability in adult male mice.
a Timeline of AAV injections, aCUS, and behavioral experiments. b Representative image of GFP expression in medial PFC of AAV-injected mouse. c Quantification of Yy1 mRNA levels in YY1-exKO mice relative to YY1-exGFP mice (Unpaired t-test with Welch’s correction; P < 0.001; n = 6 YY1-exGFP, n = 7 YY1-exKO). d Representative western blot showing YY1 and β-actin proteins in medial PFC tissue lysates from YY1-exGFP and YY1-exKO mice. Semi-quantification of YY1 knockdown (normalized to β-actin) is shown on the right (Unpaired t-test; P < 0.001; n = 4 YY1-exGFP, n = 3 YY1-exKO). e Decreased exploratory behavior in the open field arena in aCUS-exposed mice harboring selective loss of YY1 in PFC excitatory neurons (Unpaired t-test with Welch’s correction; P = 0.001; n = 10 YY1-exGFP, n = 12 YY1-exKO). f Total locomotion in the open field test is unaltered (Unpaired t-test; P = 0.58; n = 10 YY1-exGFP, n = 12 YY1-exKO). g Loss of YY1 in PFC excitatory neurons increases immobility in aCUS-exposed male mice (Unpaired t-test; P = 0.007; n = 12 YY1-exGFP, n=10 YY1-exKO). h, i Yy1-exKO males subjected to aCUS show no alterations in behavior during the h sucrose preference (Mann–Whitney U-test; P = 0.76; n = 16 Yy1-exGFP, n = 14 Yy1-exKO) and i nesting (Mann–Whitney U-test; P = 0.31; n = 16 Yy1-exGFP, n=14 Yy1-exKO) assays. j Quantitative RT-PCR measurements of Fos, Fosl2, Nr3c1, Nr3c2, and Crhr1 mRNA levels in aCUS YY1-exKO mice relative aCUS YY1-exGFP controls (Unpaired t-test; Fos P = 0.02; Fosl2 P = 0.01; Nr3c1 P = 0.0023; Nr3c2 P = 0.0024; Crhr1 P = 0.006; n = 8). k RPKM values for Fos, Fosl2, Nr3c1, Nr3c2, and Crhr1 PFC transcripts in control (n = 4) and CUS (n = 5) mice as determined by RNA-seq (Likelihood ratio test with multiple comparisons; Fos FDR = 4.20E−08; Fosl2 FDR = 1.65E−05; Nr3c1 FDR = 0.04; Nr3c2 FDR = 0.01; Crhr1 FDR = 0.06). l Snapshot of genome browser depicting nuclear RNA-seq, YY1, and H3K27ac ChIP-seq reads at the mouse Yy1 locus. Overlay of YY1 and H3K27ac ChIP signal ~5 kb upstream of the Yy1 TSS is highlighted in a red dashed line box. m Snapshot of genome browser depicting nuclear RNA-seq, YY1, and H3K27ac ChIP-seq reads mapped to the mouse Nr3c1 locus. Overlay of YY1 and H3K27ac ChIP signal ~20 kb upstream of the Nr3c1 TSS is highlighted in a red dashed line box. n Levels of YY1 enrichment at the Yy1 promoter region decrease in frontal cortices of CUS mice relative to controls (Mann–Whitney U-test; P = 0.028; n = 4 per group). o Levels of YY1 enrichment at the Nr3c1 promoter region decrease in frontal cortices of CUS mice relative to controls (Unpaired t-test with Welch’s correction; P = 0.029; n = 4 per group). *P < 0.05; **P < 0.01; ***P < 0.001; ****P < 0.0001. Error bars represent s.e.m. and statistical tests were two-sided unless stated otherwise. Source data are provided as a Source data file.

