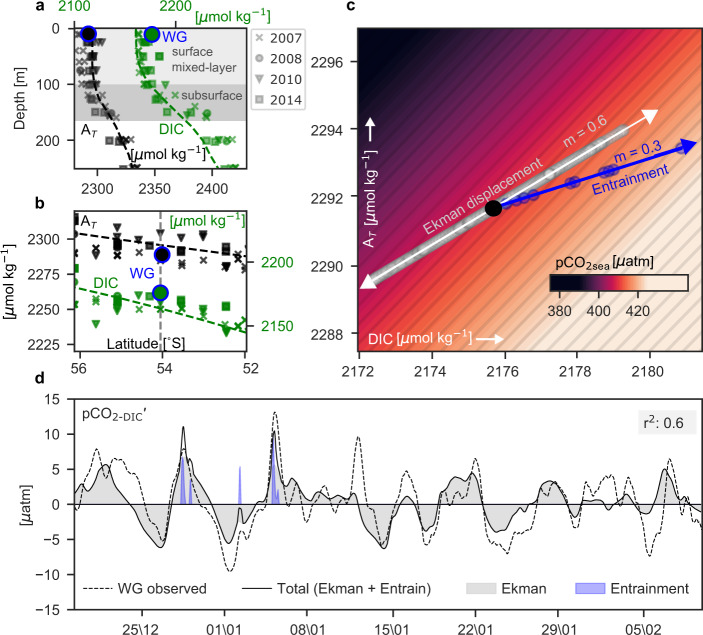
Fig. 3. Conceptual model to explain observed synoptic variability in pCO2-DIC′.
a Vertical profiles of total alkalinity (AT, black) and dissolved inorganic carbon (DIC, green) for different cruises at the location of the Wave Glider (WG) (54˚S, 0˚E) taken from GLODAPv2.202082, 83. b Lateral distribution of surface AT and DIC from the same cruises. Shown on both a and b are the average AT and DIC from the WG observations (blue outlined circles) (see Methods) and from the summer (Dec–Feb) gridded climatology (dashed lines)36, 37. c The range of WG estimated observations of surface AT (y-axis) vs DIC (x-axis) with the partial pressure of CO2 in the surface ocean (pCO2sea) as contours (µatm). Overlaid are the scatter plots of modelled lateral Ekman displacement of DIC vs AT, the modelled entrainment of DIC vs AT and the corresponding slopes (m) are shown, and the time-averaged AT and DIC value estimated from the WG (black circle). d The black line shows the model estimate of the synoptic variability of the non-thermal component of pCO2 (pCO2-DIC′) through combined Ekman advection and entrainment. The dashed line is the actual WG observed pCO2-DIC′. A rolling mean of the local inertial period is applied to both and their corresponding coefficient of determination (r2) is shown. The grey shading shows the separate estimated contribution due to Ekman advection and the blue shading of entrainment to estimated pCO2-DIC′.

