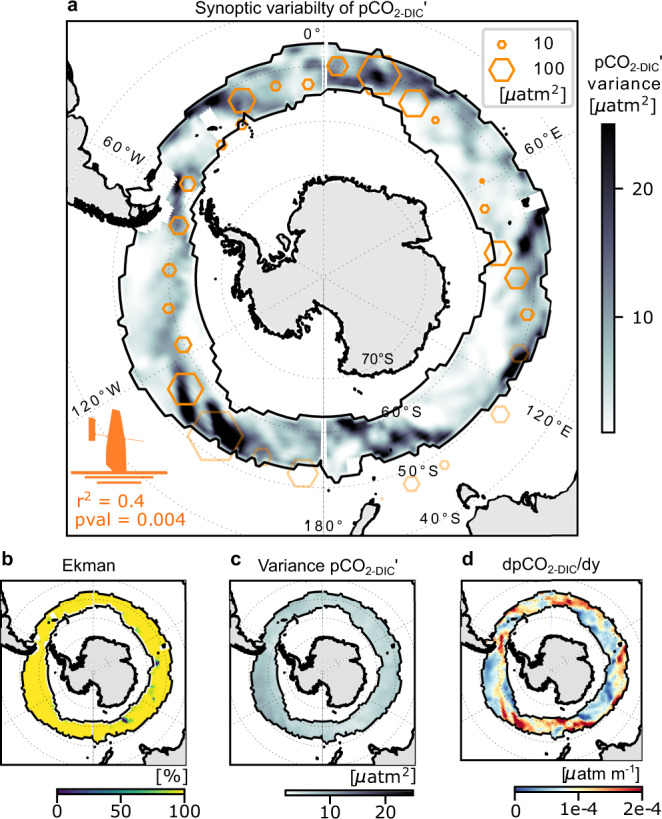
Fig. 4. The spatial distribution of synoptic variance of pCO2-DIC in the subpolar Southern Ocean.

a Modelled 7-day variance of the synoptic anomalies in the non-thermal component of pCO2 (pCO2-DIC′) [µatm]2 computed and averaged for 2019 (color bar). Overlaid are hexagons of co-located 7-day pCO2-DIC′ variance [µatm]2 as observed from a Saildrone that circumnavigated Antarctica in 201928, 42. The spatial correlation r2 and associated p-value of estimated versus observed are indicated. Hexagons outside of the subpolar domain are displayed with transparency and are excluded from the statistics. b the relative contribution of Ekman [%] to the synoptic pCO2-DIC′ variability shown in a. c shows the modelled 7-day pCO2-DIC′ variance [µatm2] as in a, instead computed using a spatially uniform gradient of total alkalinity (AT) and dissolved inorganic carbon (DIC) in Eq. 3. Thus, comparing a with c shows that the spatial variability of pCO2-DIC′ is not driven by spatial variability in wind, but rather the spatial variability driven by spatially diverse meridional gradients of AT and DIC and thus non-thermal component of pCO2 (pCO2-DIC). This is further evidenced when comparing (a) with (d) the meridional gradients of pCO2-DIC [µatm m−1]. Black contours on all panels show the location of the climatological sea-ice-edge maximum and the outgassing maximum for 2005–2019, as in Fig. 1.
