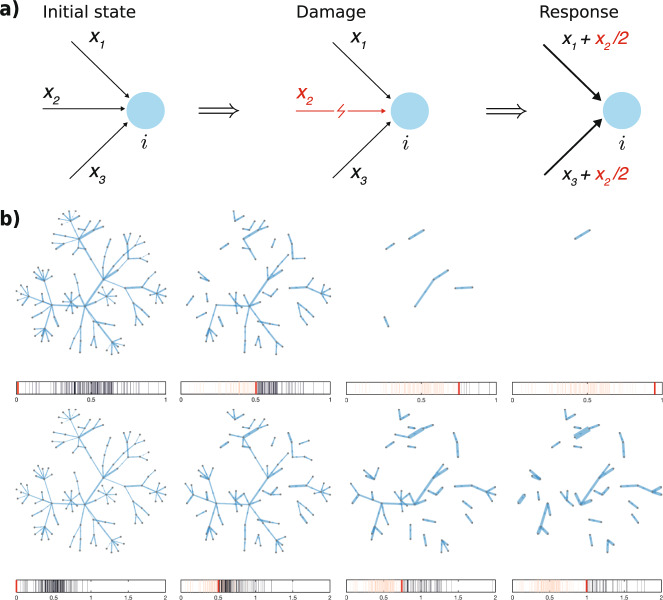
Fig. 1. Simple filtration vs. filtration with homeostatic response.
a Pictorial representation of the damage–response process for a given node i. Here, in the damaged state, one of the three initial in-edges is removed, hence its weight, w2, is equally redistributed among the surviving edges, in order to conserve the local in-strength of the initial state. b Several snapshots illustrating an example of multi-step degradation on a small network, governed by: filtration, where every edge is removed if its weight is below a given threshold (first row), and filtration with the homeostatic response that maintains the total weight of in-edges at a constant level (second row). The bars below the panels indicate the distribution of edge weights (black) and the value of the threshold red.

