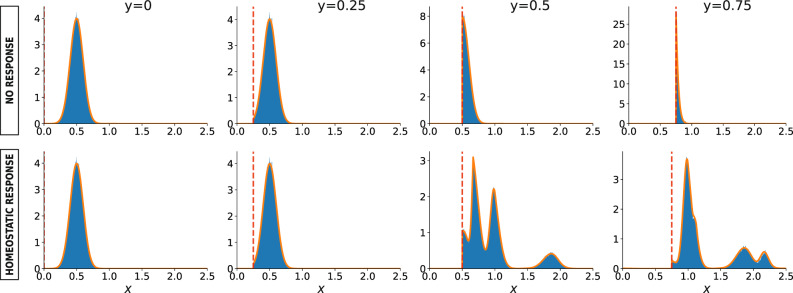
Fig. 2. Impact of the homeostatic response on the weight distribution.
Evolution of the total weight distribution w(x) on four successive instances of filtration without response (upper panel), or with the homeostatic response (lower panel), on a large random regular graph of N = 5 × 10⁴ nodes, degree z = 4 and normally distributed edge weights, at increasing values for the threshold y. The network has been generated according to the directed configuration model42, while the edge weights are distributed according to Gaussian distribution with mean μ = 0.5 and standard deviation σ = 0.1. Each plot shows the empirical weight distribution from stochastic simulations (blue histogram) compared with the prediction derived from our model (orange solid line). The vertical dashed red line in each plot represents the value of y.

