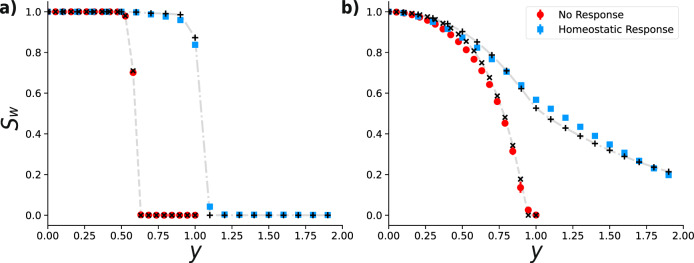
Fig. 3. Homeostatic response delays the disruption of the giant component.
Evolution of the weak giant component’s size, SW, as a function of the threshold y, for a a regular random graph of N = 2 × 10⁴ nodes and degree z = 4 with Gaussian distributed weights (the same distribution of Fig. 2), and b a brain network of N = 983 nodes representing a volume of the mouse neocortex31, 32 with uniformly distributed weights in the interval [0,1]. Colored markers represent the outcome of Monte Carlo simulations, obtained by averaging over 100 realizations of the weight distribution for the regular graph, and 1000 realizations for the real dataset. In both cases, we considered 20 successive steps of filtration without response (red circles) and with the homeostatic response (blue squares). Black markers represent the corresponding estimates from the model for each value of y, while gray dashed and dash-dotted lines represent linear interpolations between theoretical values, which serve only as visual guidelines.

