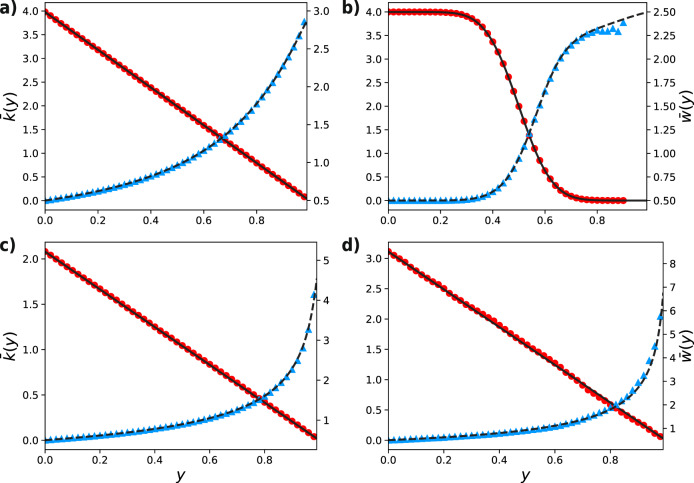
Fig. 4. Average degree and average weight for single instances of the damage–response process.
Colored markers represent the outcome of a single stochastic simulation. Solid and dashed lines represent the analytical results for average weight and degree (derived in the Methods section). Red dots and continuous lines represent the average degree (left scale), while blue triangles and dashed lines represent the average weight (right scale). a Poisson network of N = 25 × 103 nodes and uniform weights. b Random regular graph with N = 25 × 103 nodes and normally distributed weights (same distribution of Fig. 2). c Scale-free network of N = 25 × 103 nodes with power-law exponent γ = 2.5 and uniform weights. d Empirical network with uniform distributed weights (same network as in Fig. 3b).

