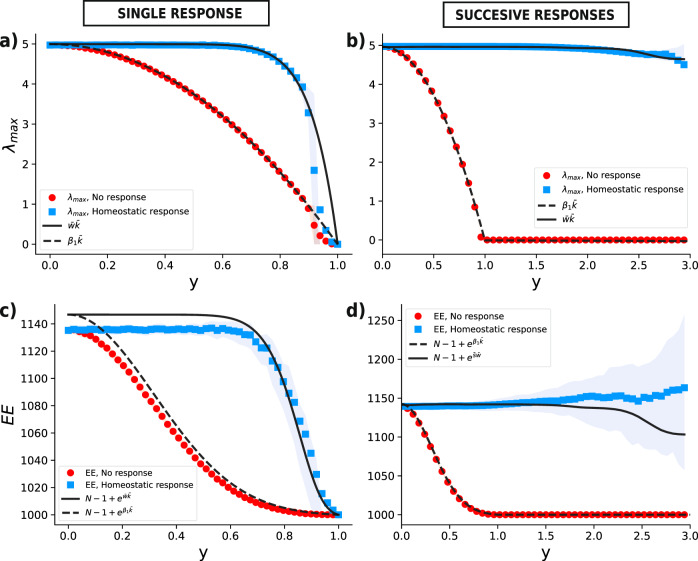
Fig. 5. Leading eigenvalue and Estrada index for both single and multiple instances of the damage-response process.
Continuous and dashed black lines represent the values from our model in the case of homeostatic response and no response respectively, while colored markers and colored shaded areas represent mean values and interquartile ranges derived from stochastic simulations. We averaged the damage-response process over 200 realizations of a random regular network of N = 103 nodes and average degree z = 10 with uniform weights. a, c Single instances of the damage–response process. In this case is simply given by combining Eqs. (3) and (6). b, d Successive instances of the damage–response process. Here, both and are computed at each step from the master equation (1). In every panel, β1 is computed from Eq. (4).

