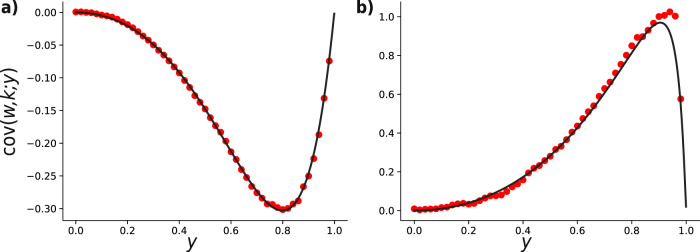
Fig. 6. Weight-degree covariance as a function of threshold y for a single instance of the damage–response process.
The initial configurations are given by: a a N = 25 × 103 nodes random regular graph with uniform weight distribution and b a N = 25 × 103 nodes scale-free network with exponent γ = 2.5, with uniform weight distribution (right panel). In both plots red markers represent the results from a single stochastic simulation, while continuous black lines show the analytical values from the theory. As we can see in the regular graph case the covariance is always negative, while the opposite happens in the scale-free network case.

