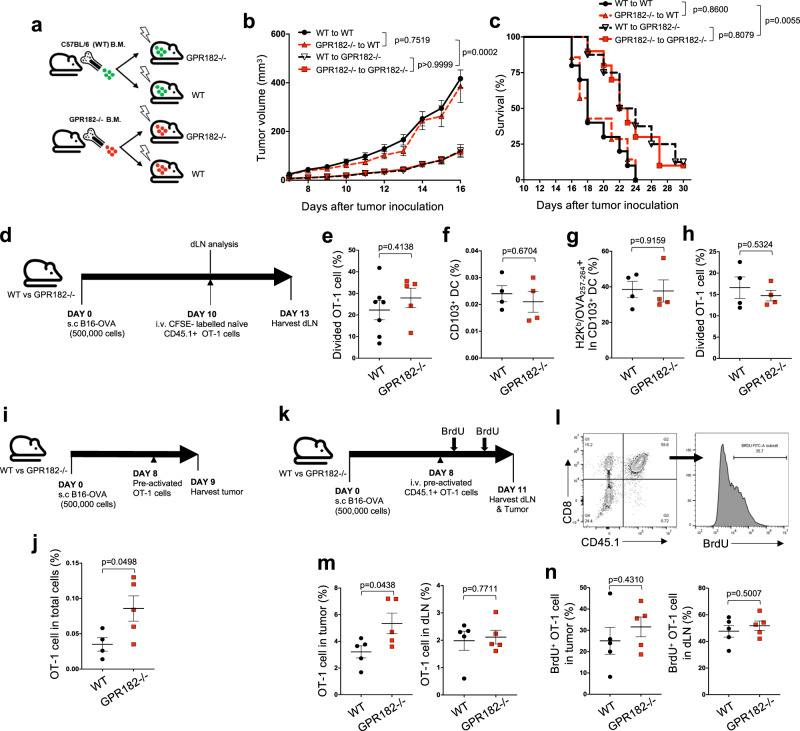
Fig. 4. Improved homing, not priming, contributes to TIL accumulation in GPR182−/− mice.
a–c Schematic of generating GPR182−/− bone marrow chimeras (a). Tumor growth curves (b) and Kaplan–Meier curves (c) for chimera mice inoculated subcutaneously with B16 tumor cells were recorded. Pooled data from two independent experiments. WT to WT, n = 10; GPR182−/− to WT, n = 7; WT to GPR182−/−, n = 8; GPR182−/− to GPR182−/−, n = 10. d–h Schematic of dLN T cell priming (d). Divided OT-1 cells in tumor dLN were quantified 72 h after transfer into mice bearing B16-OVA tumors (WT, n = 7; GPR182−/−, n = 5) (e). f–h After 10 days of tumor inoculation, single-cell suspensions were prepared from tumor dLN. The frequencies of CD103 + DC (f) and H2Kb/OVA257–264-positive cells in CD103 + DC population (g) were quantified by flow cytometry. Cell suspensions of dLN were used to stimulate CFSE-labeled naïve OT-1 cells, and divided OT-1 cells after 3-days co-culture were quantified. n = 4 per group (h). Representative data from two independent experiments. i, j Schematic of pre-activated OT-1 cell transfer (i). The frequencies of transferred OT-1 cells in tumors were quantified 24 h after transfer (j). n = 4 and 5 per group, Representative data from two independent experiments. k–n Schematic of pre-activated OT-1 cell homing (k). Representative flow cytometry plot of transferred OT-1 T cells (CD45.1 + CD8+) and BrdU staining (l). 3 days after transfer, the frequencies of transferred OT-1 cells (CD45.1 + CD8+) (m) and BrdU+ OT-1 cells (n) were quantified in tumors and dLN from WT and GPR182−/− mice. n = 5 per group. Representative data from two independent experiments. P values from two-sided student’s t-tests (e–n). Error bars represent SEM.

