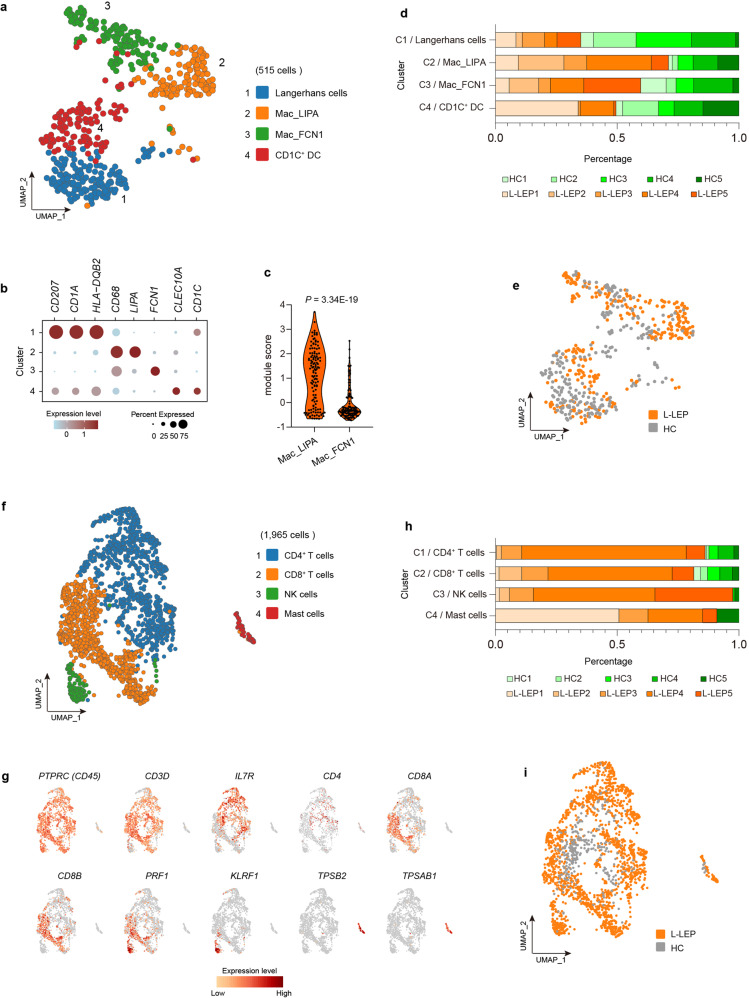
Fig. 2. Sub-clustering of the skin DC/Mac and T/NK clusters.
a UMAP visualization of the sub-clustering of skin DC/Mac cells of the discovery cohort. b Dot plot of the top marker genes for the identification of subsets in the skin DC/Mac cluster. c Module scores of each macrophage subset calculated using the top ten signature genes of each cluster (genes in Supplementary Fig. S2d). P value was calculated using a two-sided unpaired Student’s t-test. d Donor composition for each cluster obtained in the sub-clustering of skin DC/Mac cells. e UMAP plot for skin DC/Mac cells split by patients and HC. f UMAP visualization of the sub-clustering of skin T/NK cells of the discovery cohort. g UMAP plot of the top marker genes for the identification of subsets in the skin T/NK cluster. h Donor composition for each cluster obtained in the sub-clustering of skin T/NK cells. i UMAP plot for skin T/NK cells split by patients and HC.

