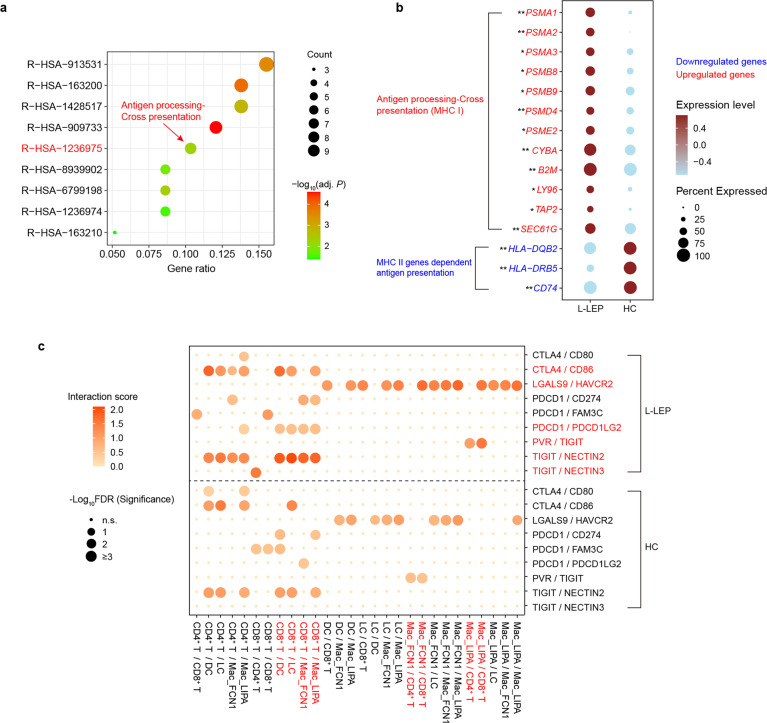
Fig. 5. Differential regulation of MHC I and II genes in Langerhans cells of L-LEP patients and the inhibitory receptors mediated interactions between skin immune cells.
a Functional enrichment analysis (Reactome database) using upregulated DEGs in Langerhans cells of the discovery cohort. The gene ratio represented the ratio of gene number enriched in a pathway to the input DEGs number. b Dot plot showing the differential expression of MHC I and II related genes in Langerhans cells of discovery cohort. * and ** indicated a significant difference between L-LEP and HC at P < 0.05 and adjusted P < 0.05 level, respectively. c Bubble chart showing the inhibitory receptors mediated interactions between skin immune cells (discovery cohort). n.s. not significant, FDR false-discovery rate.

