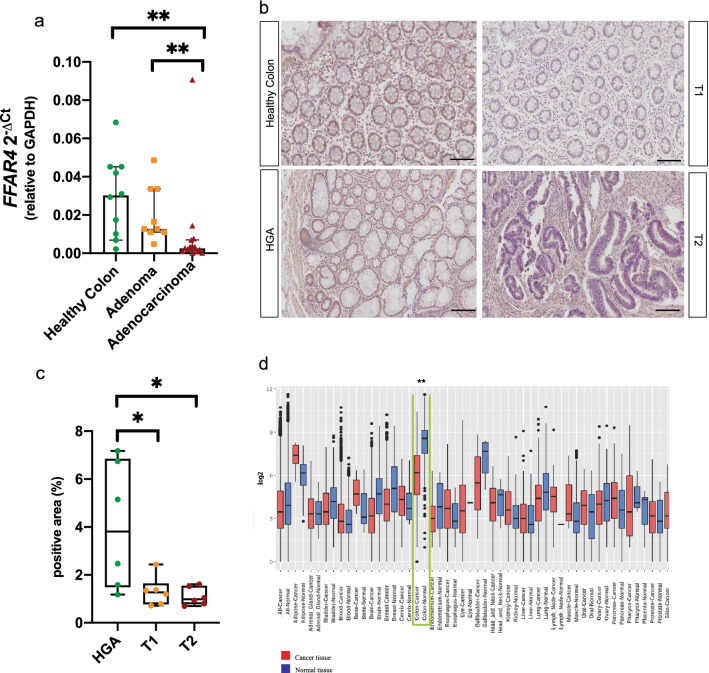
Figure 4.
Loss of epithelial GPR120 correlates with CRC development (a) The expression levels of FFAR4 gene were quantified by qRT-PCR in healthy colon (n = 9), adenomas (n = 9) and adenocarcinoma (n = 17) from human samples. (b) Representative immunostaining for GPR120 in human samples of Normal mucosa (n = 6), High-Grade Adenomas (HGA) (n = 6), T1 (n = 6) and T2 (n = 6) tumors, (c) and relative quantification of positive area. Values are expressed as median percentage of positive over total area ± 95% CI. Magnification: 20X. Scale bar: 50 μm. (d) Gene expression of FFAR4 in the indicated tissues annotated in the GENT2 database, expressed as Log2 and plotted according to tissue type. Values are expressed as median (horizontal line) ± IQR (interquartile range, boxes), dots represent outliers. Green box highlights FFAR4 expression in CRC (n = 4047) and healthy (n = 398) colon tissue. *p value < 0.05; **p.value < 0.001 by Mann Whitney test (a-c) and Student t test (d).

