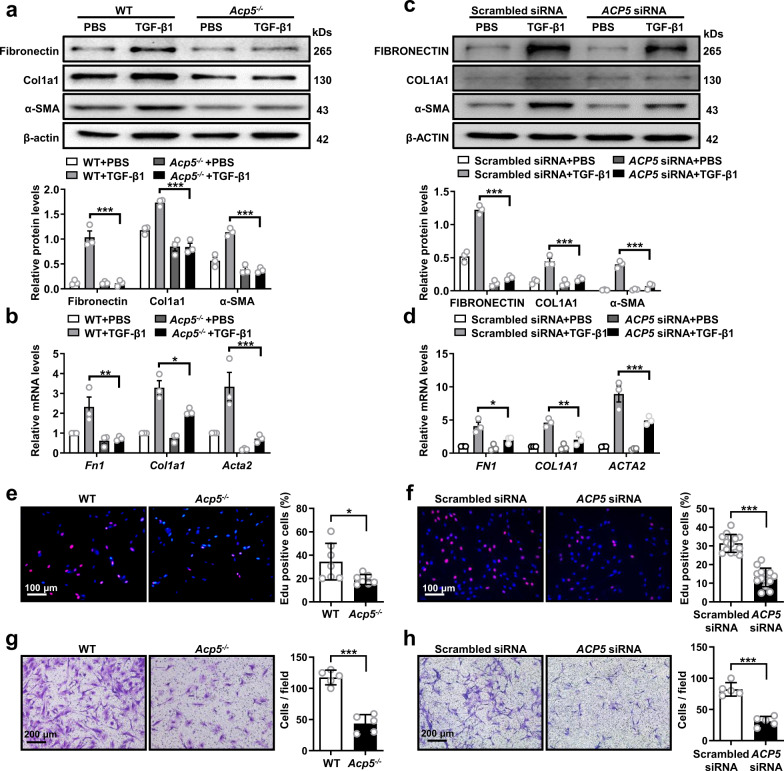
Fig. 3. The impact of ACP5 on the differentiation, proliferation and migration of fibroblasts.
a, b Western blot (a) and RT-PCR (b) analysis of Fibronectin (a: p < 0.0001, b: p = 0.0038), Col1a1 (a: p < 0.0001, b: p = 0.0284) and α-SMA (a: p < 0.0001, b: p < 0.0001) expression in PMLFs from WT or Acp5−/− mice following TGF-β1 treatment. c, d Western blot (c) and RT-PCR (d) analysis of FIBRONECTIN (c: p < 0.0001, d: p = 0.0213), COL1A1 (c: p < 0.0001, d: p = 0.0041) and α-SMA (c: p < 0.0001, d: p < 0.0001) expression in ACP5 siRNA or Scrambled siRNA treated PHLFs following TGF-β1 induction. e, f Representative results for EdU staining in WT or Acp5−/− PMLFs (e, p = 0.0421) and ACP5 siRNA or Scrambled siRNA treated PHLFs (f, p < 0.0001) g, h Representative results for Transwell assay in WT or Acp5−/− mice derived PMLFs (g, p < 0.0001) and ACP5 siRNA or Scrambled siRNA treated PHLFs (h, p < 0.0001). The data are represented as the mean ± SEM of three independent experiments. Two-sided Student’s t test (a–d, f–h) and two-sided unpaired Student’s t-test with Welch’s correction (e) were applied. *p < 0.05; **p < 0.01; ***p < 0.001. Source data are provided as a Source Data file.

