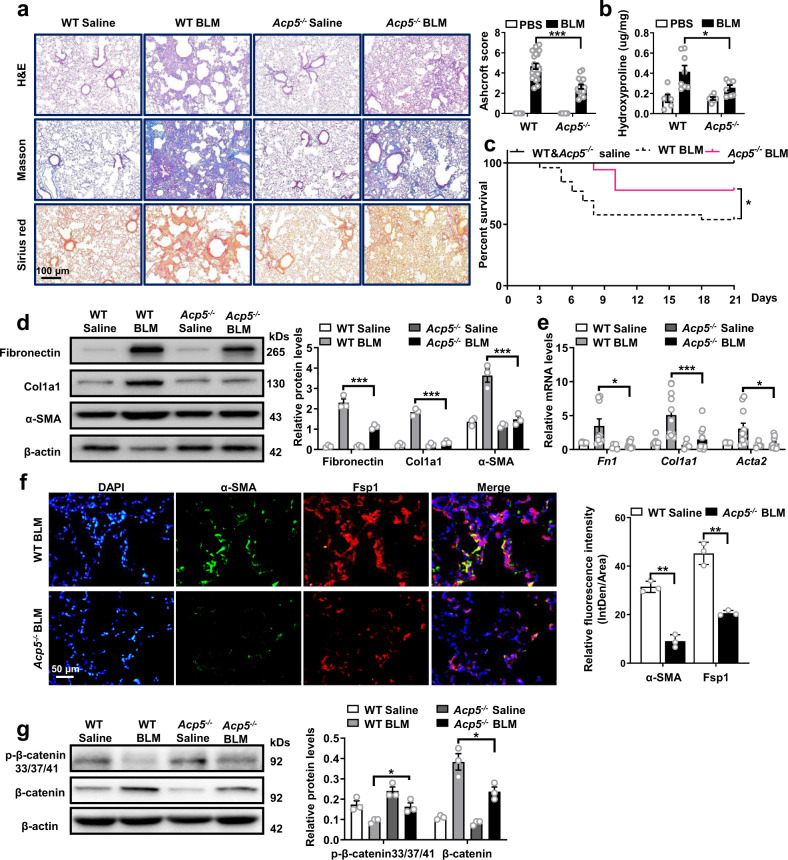
Fig. 6. Comparison of the severity of lung fibrosis between WT and Acp5−/− mice after BLM induction.
a Histological analysis of the severity of lung fibrosis in mice after BLM induction. Left panel: representative images for H&E (top), Masson staining (middle) and Sirius red (bottom). Right panel: A bar graph showed the quantitative mean score of the severity of fibrosis (p < 0.0001). Images were captured at ×200 magnification (WT Saline n = 18, WT BLM n = 22, Acp5−/− Saline n = 12, Acp5−/− BLM n = 16). b Quantification of hydroxyproline contents in WT and Acp5−/− mice (WT Saline n = 6, WT BLM n = 8, Acp5−/− Saline n = 6, Acp5−/− BLM n = 8, p = 0.0413). c The survival ratio in WT and Acp5−/− mice after BLM induction (WT Saline n = 18, WT BLM n = 40, Acp5−/− Saline n = 12, Acp5−/− BLM n = 21, p = 0.0414). d Western blot analysis of Fibronectin (p < 0.0001), Col1a1 (p < 0.0001) and α-SMA (p < 0.0001) expression in the lung homogenate from WT (n = 3) and Acp5−/− (n = 3) mice. e RT-PCR analysis of Fn1 (p = 0.0269), Col1a1 (p = 0.0001) and Acta2 (p = 0.0214) expression in the lung homogenate from WT (n = 10) and Acp5−/− (n = 11) mice. f Coimmunostaining of Fsp1 (p = 0.0025) and α-SMA (p = 0.0017) in the lung sections from WT (n = 3) and Acp5−/− (n = 3) mice. The nuclei were stained blue by DAPI, and the images were taken under original magnification ×400. g Western blot analysis of the levels of β-catenin (p = 0.0350) and p-β-catenin (S33, S37 and T41, p = 0.0238) in WT (n = 3) and Acp5−/− (n = 3) mice after BLM challenge. The data are represented as the mean ± SEM. Two-sided Student’s t-test (a, c–g) and two-sided unpaired Student’s t-test with Welch’s correction (b, e) were applied. *p < 0.05; **p < 0.01; ***p < 0.001. Source data are provided as a Source Data file.

