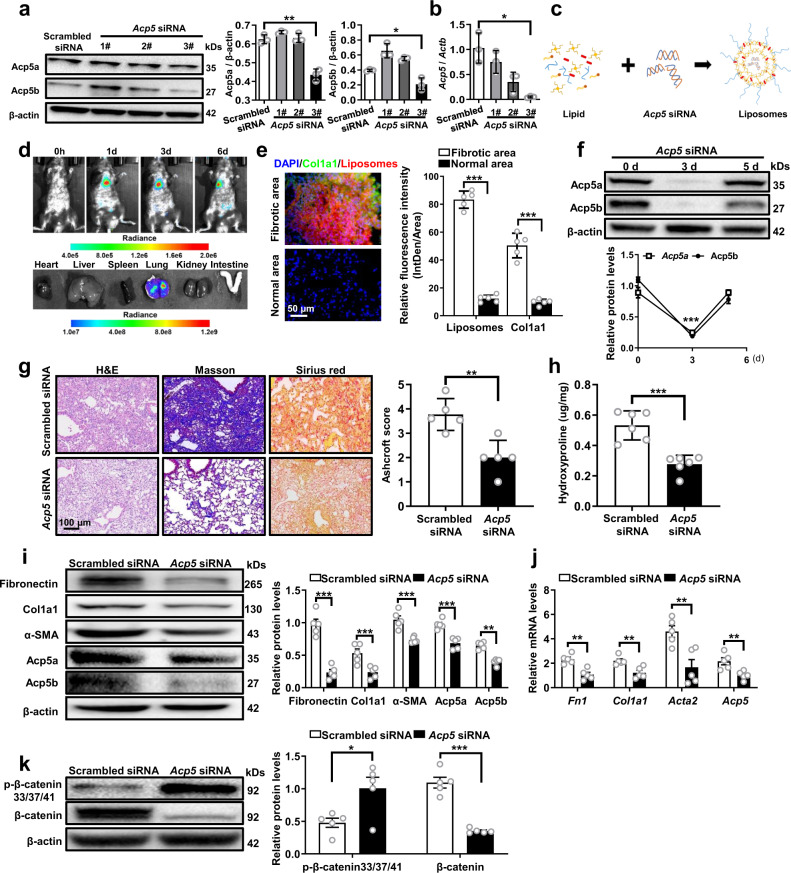
Fig. 7. Administration of Acp5 siRNA-loaded liposomes protected mice from BLM-induced lung injury and fibrosis.
a, b Western blot (a, Acp5a: p = 0.0011, Acp5b: p = 0.0205) and RT-PCR (b, p = 0.0300) analysis of the interfering efficiency of Acp5 siRNAs in PMLFs (n = 3 for each group). c Schematic diagram for preparation of liposomes carrying Acp5 siRNA. d The biodistribution of the liposomes in pulmonary fibrosis model mice (n = 6). e Representative images of immunofluorescence for the biodistribution of liposomes (Red, p < 0.0001) and Col1a1 (Green, p = 0.0003) in lungs from BLM-induced mice (n = 6). The nuclei were stained blue by DAPI, and the images were taken under original magnification ×400. f Temporal Acp5 expression changes in lungs from transfected mice (n = 5, p < 0.0001). g Histological analysis of the severity of lung fibrosis in mice after BLM induction (Scrambled siRNA liposomes group n = 5, Acp5 siRNA liposomes group n = 5, p = 0.0034). Images were captured at ×200 magnification. h Quantification of hydroxyproline contents in Scrambled or Acp5 siRNA-loaded liposomes treated mice (n = 5) after BLM injection (p = 0.0002). i–j: Western blot (i) and RT-PCR (j) analysis of Fibronectin (i: p < 0.0001, j: p = 0.0012), Col1a1 (i: p = 0.0003, j: p = 0.0057), α-SMA (i: p = 0.0001, j: p = 0.0061), Acp5a (i: p = 0.0004), Acp5b (i: p = 0.0023) and Acp5 (p = 0.0083) expression in the lung homogenate from Scrambled or Acp5 siRNA-loaded liposomes treated mice (n = 5). k Western blot analysis of the levels of β-catenin (p = 0.0007) and p-β-catenin (S33, S37 and T41, p = 0.0202) in Scrambled or Acp5 siRNA-loaded liposomes treated mice (n = 5). The data are represented as the mean ± SEM. Two-sided Student’s t test (a, e–k) and two-sided unpaired Student’s t-test with Welch’s correction (b, e, k) were applied. *p < 0.05; **p < 0.01; ***p < 0.001. Source data are provided as a Source Data file.

