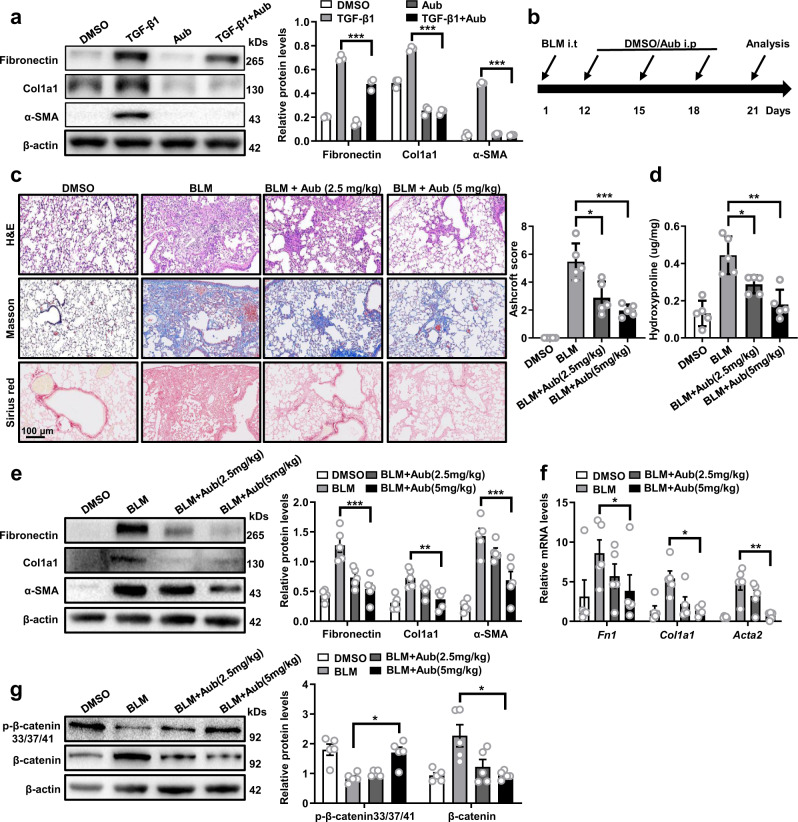
Fig. 8. Treatment with AubipyOMe (Aub) reversed the established pulmonary fibrosis.
a Western blot analysis of Fibronectin (p < 0.0001), Col1a1 (p < 0.0001) and α-SMA (p < 0.0001) in AubipyOMe treated PMLFs after TGF-β1 stimulation, Dimethyl Sulfoxide (DMSO) treated as control group. b Schematic diagram for BLM-induced model of pulmonary fibrosis and the AubipyOMe-delivery method (i.t: Intratracheal instillation, i.p: intraperitonea). c Histological analysis of the severity of lung fibrosis in mice after BLM induction. Left panel: representative images for H&E (top), Masson staining (middle) and Sirius red (bottom). Right panel: A bar graph showed the quantitative mean score of the severity of fibrosis. Images were captured at ×200 magnification. (BLM versus BLM with 2.5 mg/kg AubipyOMe: p = 0.0110, BLM versus BLM with 5.0 mg/kg AubipyOMe: p = 0.0005) d Quantification of hydroxyproline contents. (BLM versus BLM with 2.5 mg/kg AubipyOMe: p = 0.0147, BLM versus BLM with 5.0 mg/kg AubipyOMe: p = 0.0018) e-f Western blot (e) and RT-PCR (f) analysis of Fibronectin (e: p < 0.0001, f: p = 0.0146), Col1a1 (e: p = 0.0066, f: p = 0.0101), and α-SMA (e: p < 0.0001, f: p = 0.0083) expression. g Western blot analysis of the levels of β-catenin (p = 0.02241) and p-β-catenin (S33, S37 and T41, p = 0.0213). Each bar represents the mean ± SEM of 5 mice analyzed. Two-sided Student’s t test (a–g) and two-sided unpaired Student’s t-test with Welch’s correction (f, g) were applied. *p < 0.05; **p < 0.01; ***p < 0.001. Source data are provided as a Source Data file.

