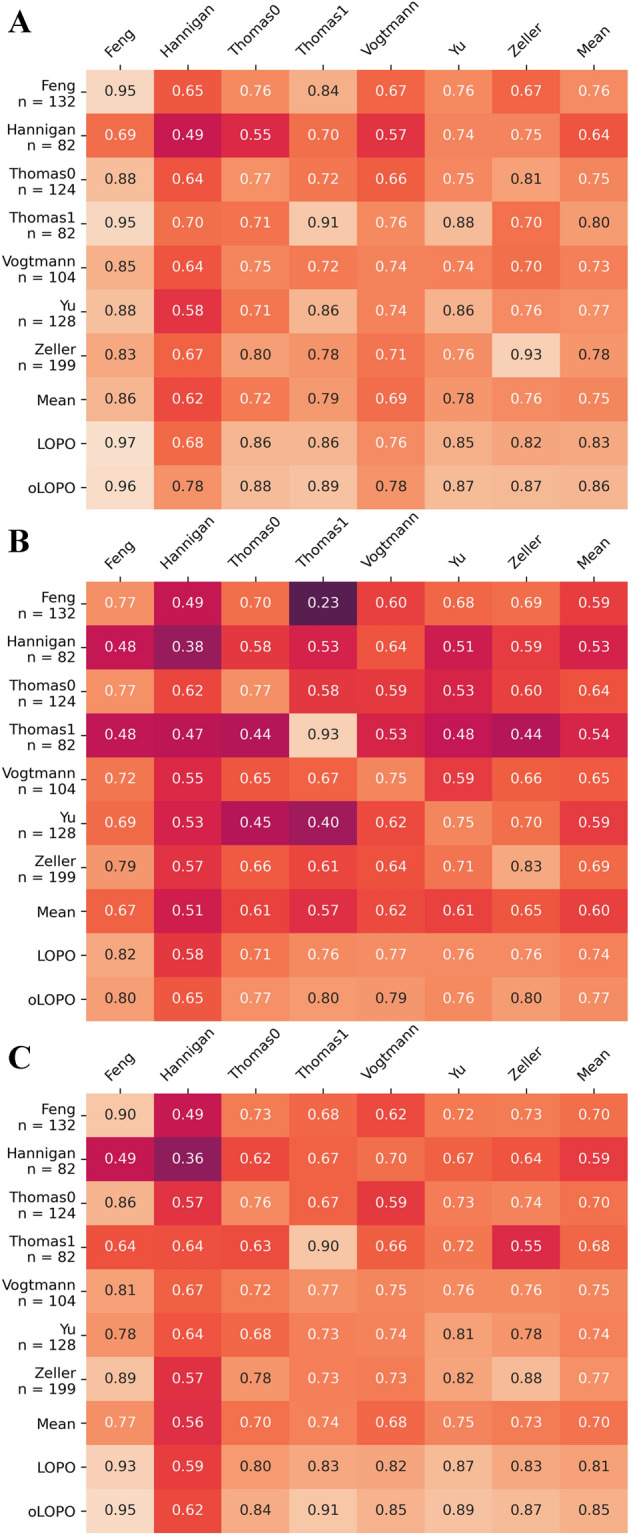
Figure 4.

Cross-prediction matrix that measures the performance of the proposed model in terms of the area under the receiver operating characteristic curve (AUROC) for (A) taxonomic, (B) KEGG and (C) eggNog metagenomic profiles. The diagonal represents the intra-project performance by reporting the mean of the AUROC of 20-times tenfold cross validation, whereas the off-diagonal shows the cross-dataset performance, i.e. train with the model indicated in the rows and test over the project in the columns. Finally, the Leave one Project Out (LOPO) row reports the performance of predicting the dataset referred to in the columns while training with the other datasets, whereas the oLOPO row is the same experiment but using the functional signature learned during the LOPO procedure.
