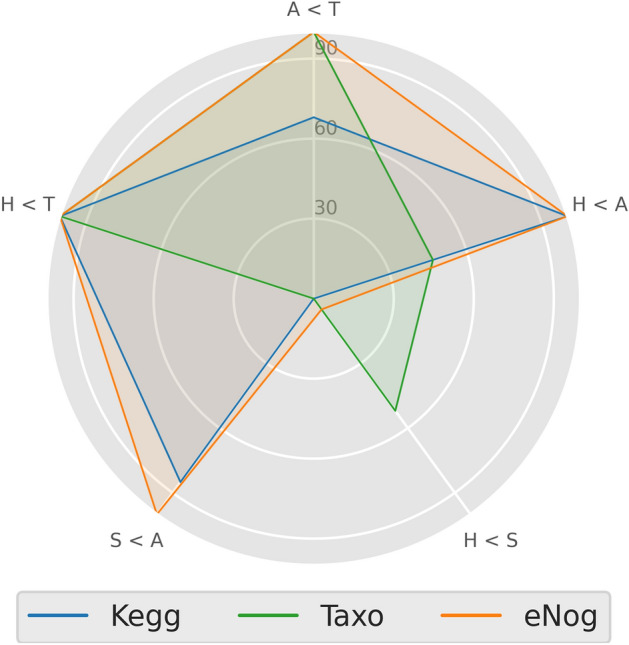
Figure 6.

Radar plot with the performances of the different comparisons of the distribution of the probabilities between pairs of categories of samples using a Mann–Whitney rank test. Comparisons are clockwise: Adenoma < Tumor (A < T), healthy < Adenoma (H < A), healthy < small adenoma (H < S), Small adenoma < Adenoma (S < A) and healthy < tumor (H < T). Models were trained with Taxonomic (Taxo) and functional features (KEGG and eggNOG).
