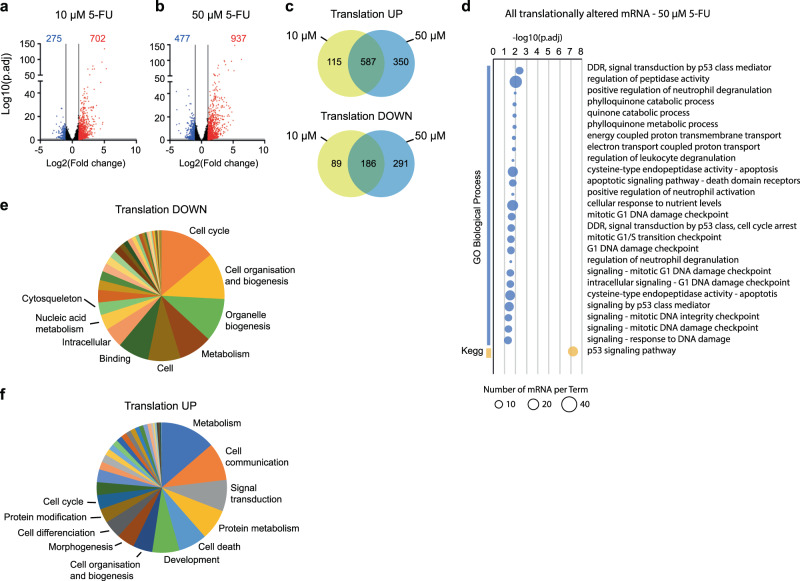
Fig. 5. Alteration of specific mRNA translation by 5-FU.
HCT116 cells were untreated (NT) or treated with 10 µM or 50 µM 5-FU for 24 h and mRNA translation was assessed by RNA-sequencing of polysome-associated mRNAs. a–b, mRNA association with polysomes was compared between 10 µM (a) or 50 µM (b) 5-FU treated and untreated cells, and significance was tested using a two-sided Wald test from DESeq2 R package. Adjustments for multiple comparisons were made using Benjamini and Hochberg correction method. P values for individual mRNA are available in Supplementary Data 2. The data show all analyzed mRNAs. mRNAs whose polysomal level either increased (red) or decreased (blue) by more than twofold between untreated and 5-FU treated cells are colored (p.adj < 0.05). The threshold +/− 1 log2(FC) is indicated by vertical lines. The number of significantly altered mRNAs is indicated on top of the graphs. c Same datasets as in (a) and (b). Venn diagrams showing the comparison of translationally upregulated and downregulated mRNAs in 10 µM and 50 µM 5-FU treated cells. d Gene ontology analysis of all translationally altered mRNAs upon treatment with 50 µM 5-FU. The data show enriched GO terms for biological processes category (GO-Term-BP) and KEGG pathways. Analysis performed using gprofiler63. e–f, Significantly enriched GO terms were clustered in sub-groups according to GOslim2 classification and using with the CateGOrizer webservice64. The pie charts summarize the list of functional sub-groups in order of decreasing importance respectively for translationally downregulated genes (e) and translationally upregulated genes (f). The colours were chosen by order of importance, and do not represent the same groups in (e) and (f). Source data are provided as a Source Data file.

