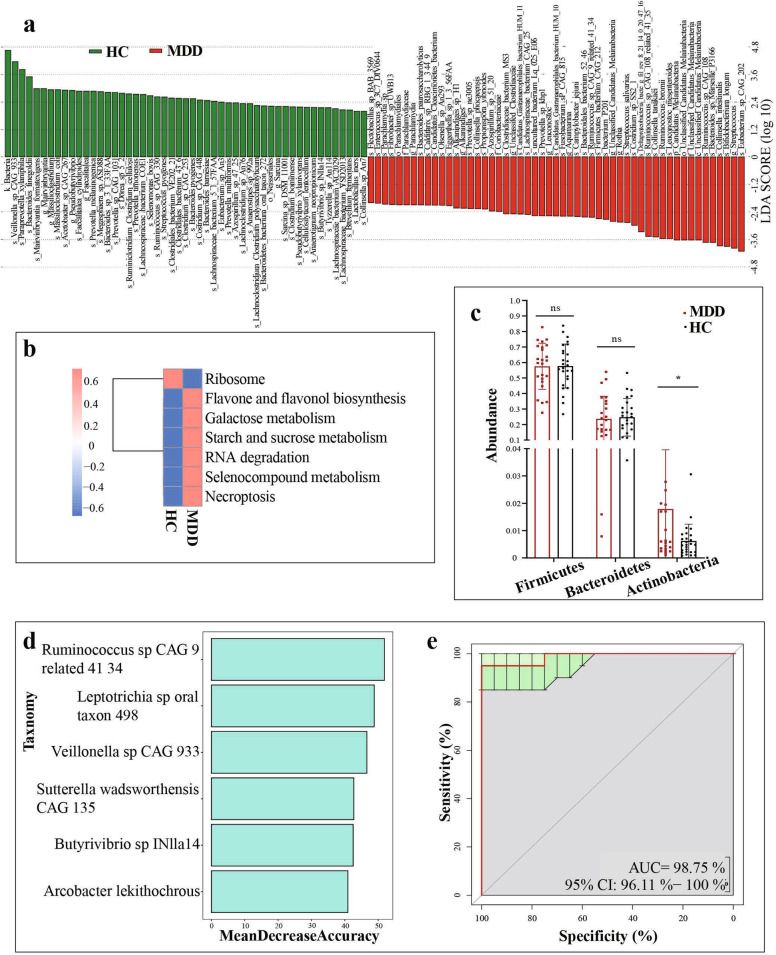
Fig. 2. Alterations of gut microbiota in MDD patients.
a LDA scores revealed different composition in bacterial taxa between MDD and HCs (LDA = 2). Red bars indicate taxa were enrichment in MDD, and green bars represent abundant bacterial taxa in HCs. b Differential biological processes of gut microbiome function in MDD groups (red) relative to HCs (blue). c At the phylum level, the abundance of Firmicutes and Bacteroidetes were decreased in the MDD group relative to HCs, while Actinobacteria were significantly higher in the MDD group than in the HC group. ns: p > 0.05; *p < 0.05. d–e Using random forest models to predicted MDD diagnosis through biomarkers. b Six Biomarkers were screened according to Mean Decrease Accuracy in random forest. Rank the species from top to bottom according to their degree of contribution. c Receiver operating characteristic (ROC) curves of response predicted by random forest models. The area under the ROC curve (AUC) was 0.98 (95% CI: 0.961–1).

