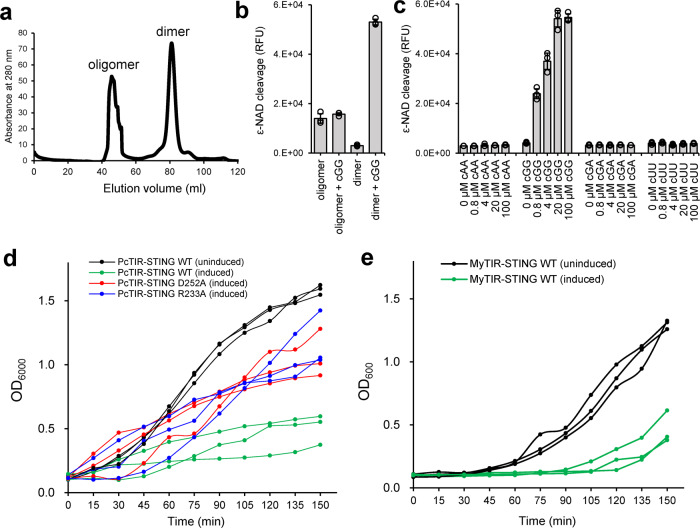
Fig. 4. Oligomerization and functional activation of bacterial TIR-STING.
a Size-exclusion chromatography of MyTIR-STING proteins. The first peak eluting within void volume was denoted as oligomerized MyTIR-STING. The second peak was calculated as dimeric MyTIR-STING. b NAD+ cleavage activity of the oligomerized or dimerized MyTIR-STING in the presence or absence of 100 μM c-di-GMP (cGG). c NAD+ cleavage activity of dimerized MyTIR-STING with different cyclic dinucleotides (0, 0.8, 4, 20, 100 μM). cAA, cyclic di-AMP; cGA, 3’,3’-cGAMP; cUU, c-di-UMP. The data in (b) and (c) are shown as mean ± standard deviation for n = 3 independent replicates. The effector TIR domain is active only in the presence of c-di-GMP. d Growth curves of E. coli cells overexpressing wild-type (green line), D252A (red line), or R233A (blue line) mutant PcTIR-STING proteins. The E. coli cells carrying wild-type PcTIR-STING without induction (black line) serve as a negative control. Significant bacterial growth inhibition was induced by wild-type PcTIR-STING proteins and largely restored by D252A or R233A mutant which abolish the specificity for c-di-GMP recognition. e MyTIR-STING toxicity analysis using E. coli cells producing endogenous c-di-GMP. Induction of the expression of MyTIR-STING proteins (green line) caused dramatic bacterial growth arrests in host cells compared with the no IPTG induction control (black line). The experiments in (d) and (e) were performed for n = 3 biological replicates and each of them is shown.

