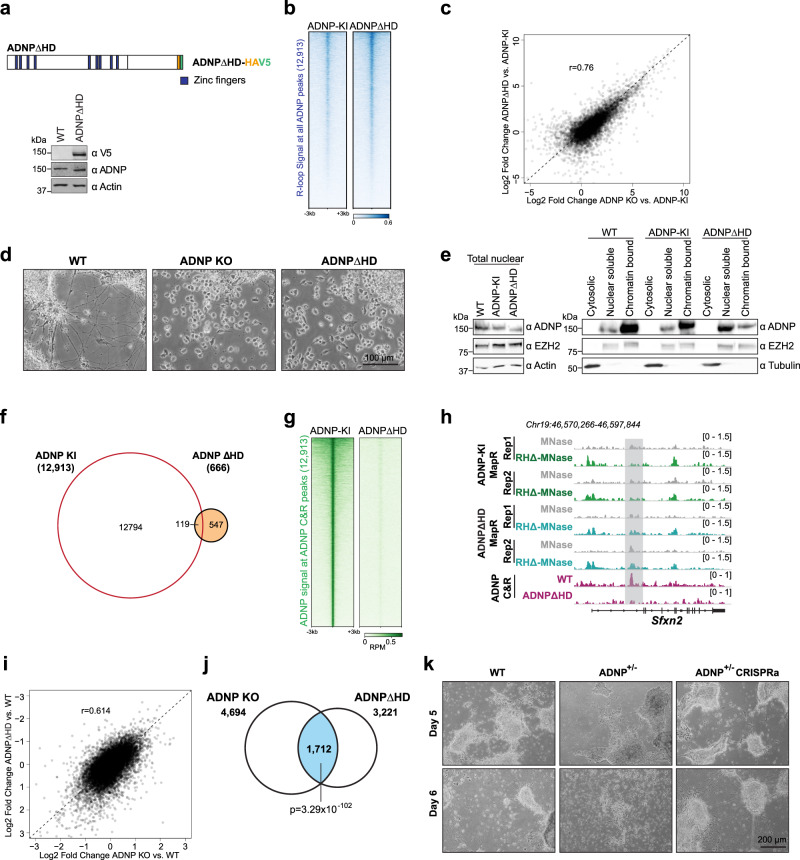
Fig. 6. ADNP homeodomain deletion results in protein mislocalization and R-loop accumulation.
a Schematic of HA and V5 epitope-tagged ADNPΔHD (top). Zinc fingers are in blue. Western blot for V5 tag and ADNP in parental WT and ADNPΔHD mESCs (bottom). Actin serves as loading control. Antibodies indicated on the right. b Heatmap of normalized MapR signal in ADNP-KI and ADNPΔHD mESCs across 6-kb windows centered on ADNP CUT&RUN peaks. Rows are sorted in decreasing order by mean signal across all samples. c Scatterplot of log2 fold changes in R-loop read density between control and ADNP KO mESCs and log2 fold changes between ADNP-KI and ADNPΔHD mESCs across 12,913 ADNP peaks. Pearson correlation, 0.76. d Representative images of WT, ADNP KO, and ADNPΔHD cells on day 5 of differentiation. e Western blot for ADNP, EZH2, Actin, and Tubulin in WT, ADNP-KI, and ADNPΔHD mESCs total nuclear extract (left), and upon fractionation into cytosolic, nuclear soluble and chromatin-bound fractions (right). Antibodies are indicated on the right. f Venn diagram showing overlap between 12,913 ADNP CUT&RUN peaks and 666 ADNP CUT&RUN peaks called in ADNP-KI and ADNPΔHD, respectively. g Heatmap of ADNP CUT&RUN signal (RPM) in ADNP-KI and ADNPΔHD mESCs across 6-kb windows centered on 12,913 ADNP peaks. Rows are sorted in decreasing order by mean signal across all samples. h Genome browser view of the Sfxn2 gene showing MapR signal (RPM) in ADNP-KI and ADNPΔHD mESCs and ADNP CUT&RUN signal (RPM) in ADNP-KI and ADNPΔHD mESCs. i Scatterplot of log2 fold changes in RNA-Seq expression between WT and ADNP KO mESCs and log2 fold changes between WT and ADNPΔHD mESCs for 11,973 expressed genes. Pearson correlation, 0.614. j Venn diagram showing overlap between 4694 genes differentially expressed in ADNP KO and 3221 genes differentially expressed in ADNPΔHD. p-value of overlap = 3.29 × 10−102, hypergeometric test. k Representative images of WT, ADNP+/−, and ADNP+/− CRISPRa cells on days 5 and 6 of neuronal differentiation. Source data underlying a, d, e, k are provided as a Source data file.

