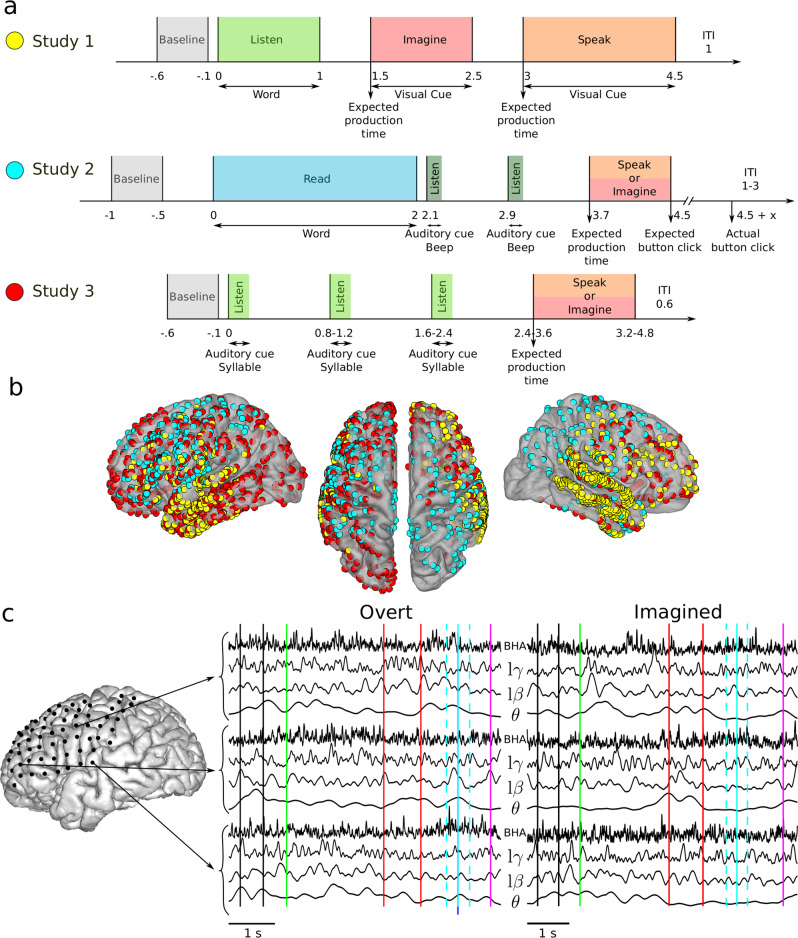
Fig. 1. Experimental studies and electrode coverage.
a Study 1 (top row): after a baseline (0.5 s, gray), participants listened to one of six individual words (1 s, light green). A visual cue then appeared on the screen, during which participants were asked to imagine hearing again the same word (1 s, red). Then, a second visual cue appeared, during which participants were asked to repeat the same word (1.5 s, orange). Study 2 (middle row): after a baseline (0.5 s, gray), participants read one of twelve words (2 s, blue). Participants were then asked to imagine saying (red) or to say out loud (orange) this word following the rhythm triggered by two rhythmic auditory cues (dark green). Finally, they pressed a button, still following the rhythm, to conclude the trial. Study 3 (bottom row): after a baseline (0.5 s, gray), participants listened to three auditory repetitions of the same syllable (light green) at different rhythms, after which they were asked to imagine saying (red) or to say out loud the syllable (orange). b ECoG electrode coverage across all participants. Yellow, blue and red electrode colors correspond to the study 1, 2, and 3 respectively. c Example of one overt and one imagined trial for patient #8 (Geneva study). Time series extracted in the four frequency bands of interest are shown. Vertical lines indicate relevant time events in the study: baseline period (between black lines), word appear on screen (green), auditory cues (red), expected speech time (light blue), actual speech time (dark blue), analysis window (light dashed blue), and manual response (purple).

