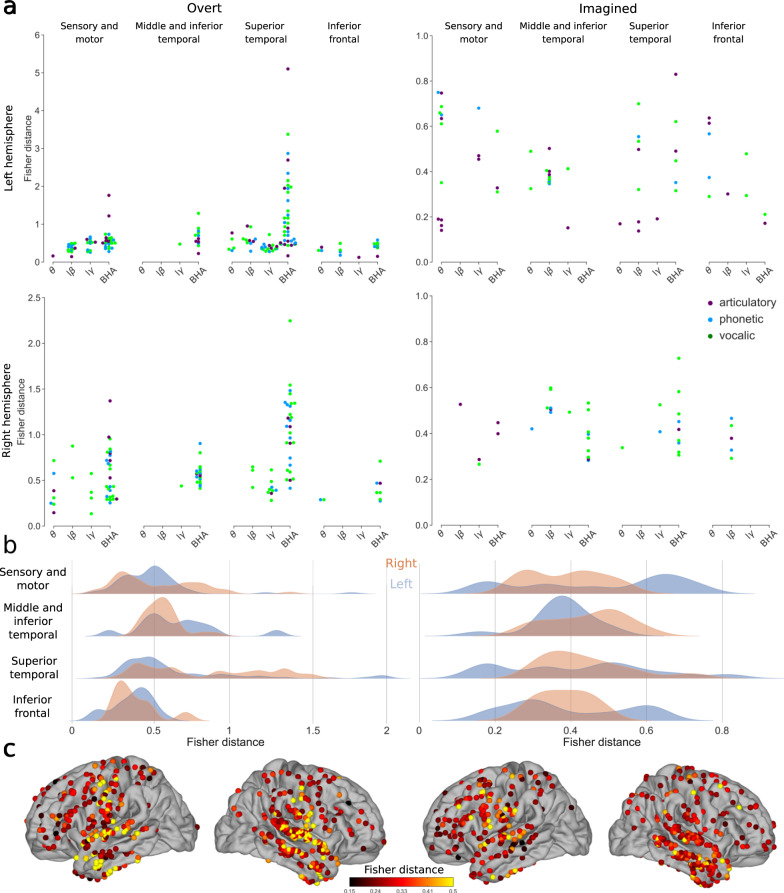
Fig. 5. Discriminability between different representations using power spectrum for overt and imagined speech.
a Significant Fisher distances between articulatory (purple), phonetic (blue) and vocalic (green) representations in different brain regions and frequency bands (only significant Fisher distances are shown, permutation tests, FDR-corrected, target threshold α = 0.05). Note the different scales between overt and imagined speech. b Distributions of significant Fisher distances for each brain region and left (blue) and right (orange) hemispheres across all representations and frequency bands (only significant Fisher distances are used, permutation tests, FDR-corrected, target threshold α = 0.05). c Maximum significant Fisher distance for each electrode across all representations and frequency bands. When several significant Fisher distances were found for the same electrode, only the maximum value is shown and only significant electrodes are shown (permutation test, p < 0.05, no FDR correction). Left column: overt speech. Right column: imagined speech. Results are pooled across all studies, results for separated studies as shown in Supplementary Fig. 17. Source data are provided as a Source Data file. lβ low beta, lγ low gamma, BHA broadband high-frequency activity.

