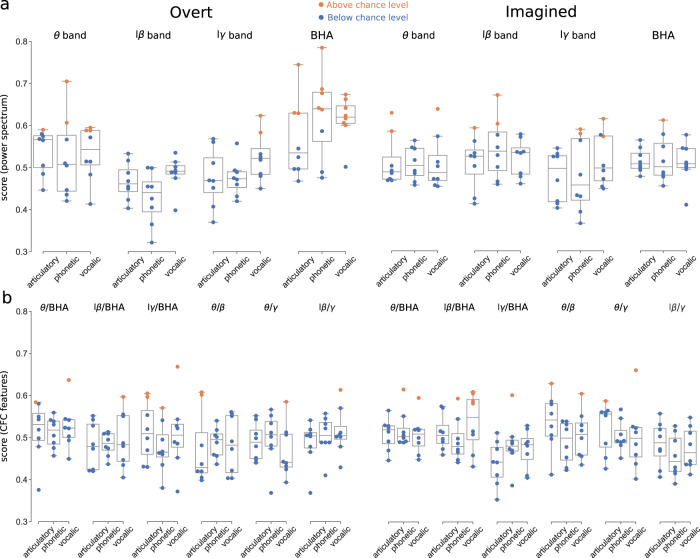
Fig. 7. Decoding overt (left) and imagined (right) speech.
Orange circles indicate above, significant (vs. blue circles below) chance level performance for each participant respectively (N = 8, studies 1 and 2). Boxplots’ center, bound of box, and whiskers show respectively the median, interquartile range, and the extent of the distribution (outliers excepted). Significant levels were obtained for each subject based on the number of trials performed (see Methods section). a Decoding performance using power spectrum features. b Decoding performance using phase-amplitude CFC features. Left column: overt speech. Right column: imagined speech. Source data are provided as a Source Data file. lβ low beta, lγ low gamma, BHA broadband high-frequency activity.

