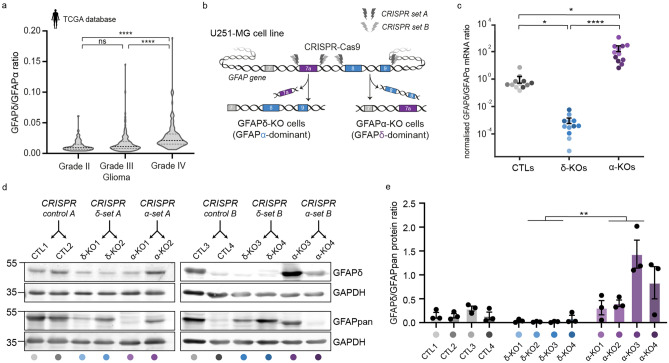
Figure 1.
GFAPδ/GFAPα ratio in the TCGA database and generation of GFAP isoform KO clones to regulate the GFAPδ/GFAPα ratio in U251-MG glioma cells. (a) Violin plots of the GFAPδ/GFAPα ratio in tumour samples of grade II (n = 64), grade III (n = 130), and grade IV (n = 153) astrocytoma, obtained from normalised isoform expression data of the TCGA database. Significance was determined using a Kruskal–Wallis test followed by a Dunn’s multiple comparisons test. (b) Schematic illustration of the GFAP gene with the CRISPR-Cas9-targeted locations to generate GFAPδ- and GFAPα-KO cell clones. GFAPδ-KO and GFAPα-KO cell clones were generated using two sets of sgRNAs (CRISPR set A and B) and four clones per isoform-KO were selected and characterised, leading to a total of 12 cell clones. (c) GFAPδ/GFAPα mRNA ratio of the GFAP isoform KO cells and controls, represented on a log10 scale. Depletion of exon 7a (GFAPδ-KO) leads to a decrease in the GFAPδ/GFAPα ratio compared to the control cells, whereas depletion of exons 8 and 9 (GFAPα-KO) leads to an increase in the ratio. n = 12 biological repeats per group, derived from 4 clones per condition represented with different colour hues. Significance was determined using a Kruskal–Wallis test followed by a Dunn’s multiple comparisons test. (d) Protein levels of GFAPδ and all GFAP isoforms (GFAPpan) in the 12 different cell clones generated with the different CRISPR sets (CRISPR control A, CRISPR δ-set A, CRISPR α-set A, CRISPR control B, CRISPR δ-set B, CRISPR α-set B) determined with Western blot. Full-lenth blots are presented in Supplementary Fig. 6 (e) Quantification of GFAPδ/GFAPpan levels in the 12 different cell clones. Significance was determined using a Kruskal–Wallis test followed by a Dunn’s multiple comparisons test. The data is shown as mean ± S.E.M, *p < 0.05, **p < 0.01, ***p < 0.001, ****p < 0.0001, ns = not significant.

