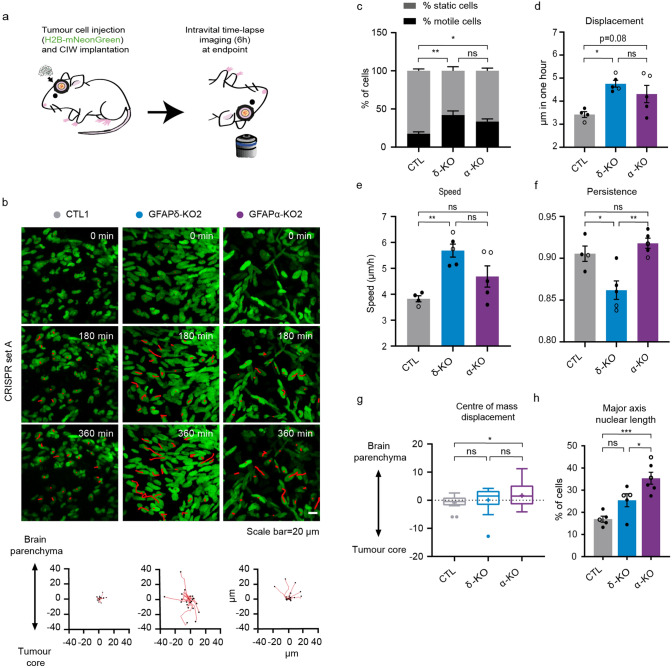
Figure 4.
In vivo migratory behaviour of tumour cells with different GFAPδ/α ratios. (a) Schematic representation of implantation of CIW and intravital time-lapse imaging over 6 h with an interval of 45 min. (b) Representative still images from a time-lapse movie showing migratory tumour cells in different GFAP -modulated tumours (CTL1, GFAPδ-KO2, GFAPα-KO2). Red lines highlight individual tumour cell tracks. Scale bar = 20 µm. Corresponding plots represent tracks from a common origin showing the direction of the tumour cells either towards the tumour core or the brain parenchyma. (c) Percentage of motile (cell displacement > 2 μm/hour) and static cells for each tumour type. (d) Quantification of cell displacement of motile cells for the indicated tumour type. (e) Cell speed of motile cells for the different cell clones (µm/h). (f) Cell persistence of motile cells in the different cell clones. Black dots represent clones from CRISPR set A (CTL1, GFAPδ-KO2, GFAPα-KO2) and white dots clones from CRISPR set B (CTL3, GFAPδ-KO3, GFAPα-KO4). (g) Tukey-style whiskers plot of the centre of mass displacement of individual positions of each condition. (h) Quantification of nuclear cell length in the different cell clones. % of cells with a length higher than 30 µm is represented. n = 4 (CTLs), n = 5 (GFAPδ-KO), and n = 5 (GFAPα-KO) CIW mice implanted with 2 different cell clones, one of each CRISPR set. The data is shown as mean ± S.E.M, *p < 0.05, **p < 0.01, ***p < 0.001, ****p < 0.0001, ns = not significant, one-way ANOVA or two-way ANOVA followed by Tukey’s multiple comparisons test.

