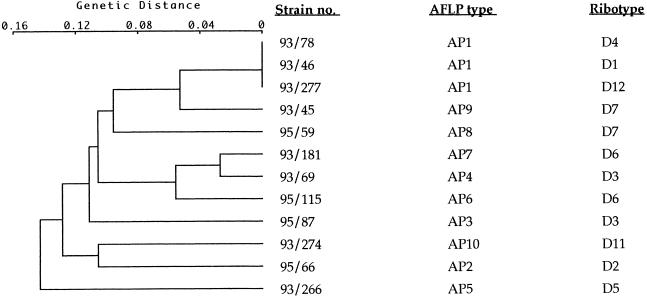
FIG. 2.
Cluster analysis of the AFLP profiles of the C. diphtheriae strains shown in Fig. 1. The strain numbers, AFLP types, and ribotype designations are given on the right. Analyses were performed with the Taxotron software package (Institut Pasteur). Patterns were clustered by the single-linkage method with a fixed tolerance of 4%. A genetic distance of zero is equal to 100% similarity.

