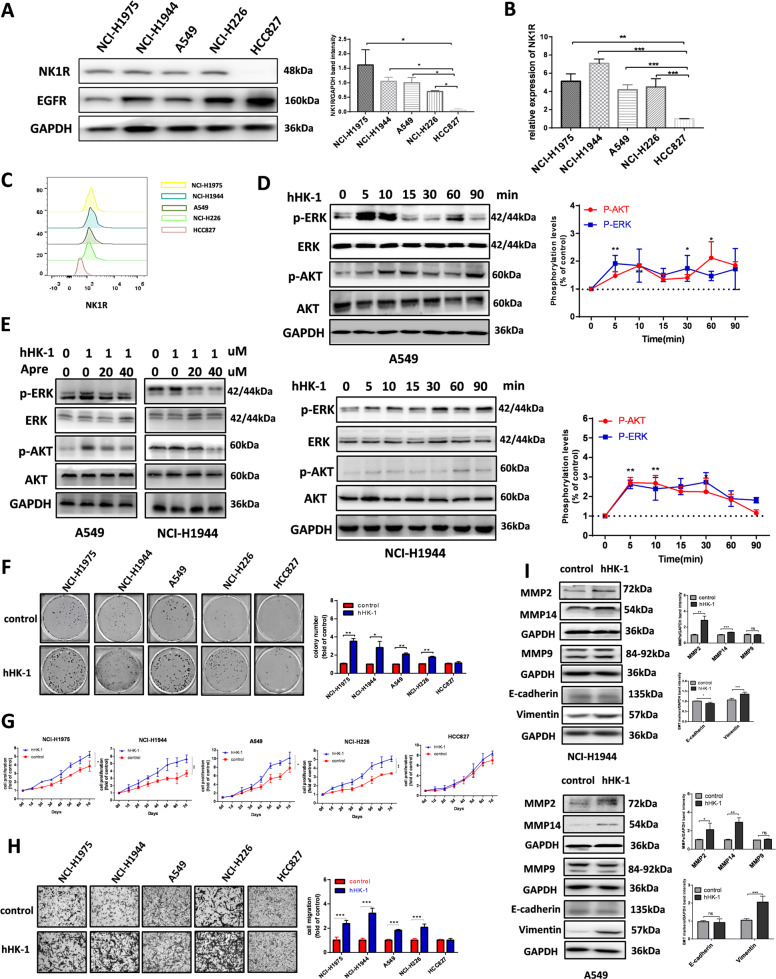
Fig. 2. NK1R promotes NSCLC progression in vitro.
A Western blot and B real-time PCR analysis of NK1R expression in NSCLC cell lines. C FACS analysis of NK1R expression on cellular surface membrane. HCC827 cell lysate was used as a negative control. D Western blot analysis of hHK-1 induced ERK1/2 and Akt phosphorylation in NSCLC cell lines. E Aprepitant reduced the phosphorylation of ERK1/2 and AKT triggered by hHK-1. Total ERK1/2 and Akt were used as a loading control. The effect of NK1R activation by 1 μM hHK-1 on F cell colony formation (colonies larger than 0.1 mm in diameter were counted), G cell growth curve, H transwell cell migration, and I E-cadherin/vimentin, MMP2/14 protein level. The densitometric analysis of each band was calculated with Image J software. Data were shown as mean ± SD from three independent experiments. *P < 0.05, **P < 0.01, ***P < 0.001.

