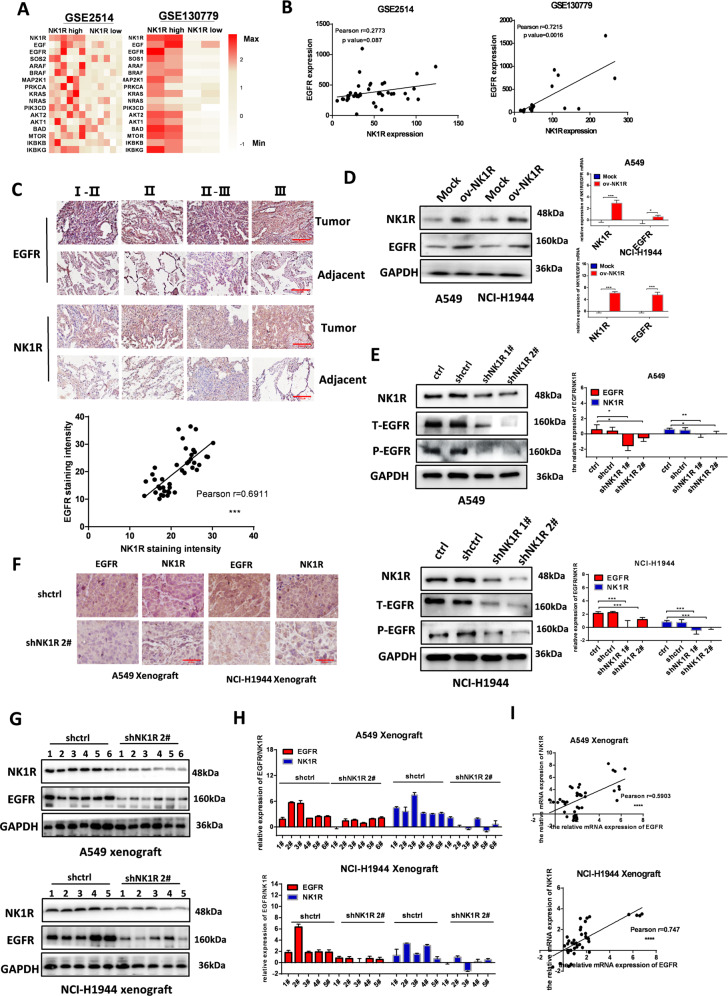
Fig. 5. NK1R expression was correlated with EGFR in NSCLC.
A Heatmap showing the differential NK1R expression and EGFR signaling activity in GSE2514 (NK1Rhigh, n = 6; NK1Rlow, n = 6) and GSE130779 (NK1Rhigh, n = 2; NK1Rlow, n = 2). B mRNA expression level of NK1R was plotted against EGFR in patient samples from GSE2514 and GSE130779. C IHC staining of NK1R and EGFR protein expression in tissue microarrays of 30 human lung adenocarcinoma patients (upper panel). IHC staining intensity of NK1R was plotted against EGFR (down panel). Scale bar, 200 μm. D Western blot and E real-time PCR analysis of NK1R and EGFR expression in NSCLC cells transfected by pLenti-EGFP-Puro-CMV-NK1R plasmid (NK1R overexpression, ov-NK1R) or by shRNA targeting NK1R (shNK1R). F IHC staining (scale bar, 50 μm), G Western blot and H real-time PCR analysis of NK1R and EGFR protein expression in the tissue samples of nude mice xenograft models. I mRNA expression level of NK1R was plotted against EGFR in tissue samples of nude mice xenograft models. The IHC staining and densitometric analysis of each band were calculated with Image J software. Data were shown as mean ± SD from three independent experiments. *P < 0.05, **P < 0.01, ***P < 0.001.

