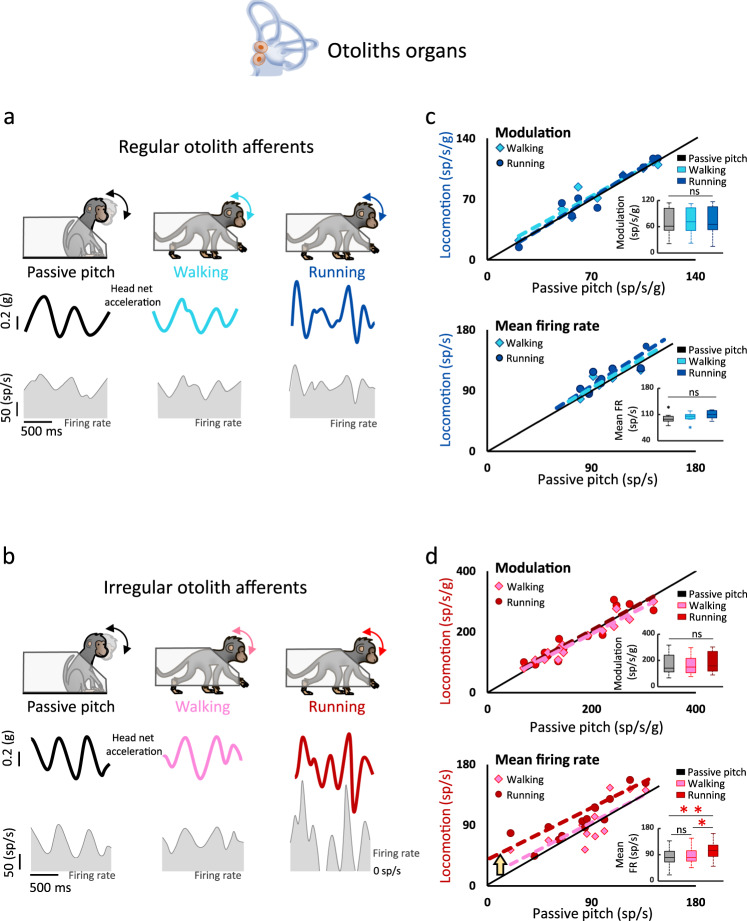
Fig. 3. Irregular otolith afferents demonstrate an increase in mean firing rate during running versus walking/passive conditions.
a, b Regular and irregular otolith afferents robustly respond in the passive, walking and running conditions. Bottom panels show the firing modulation (shaded area) of an example regular afferent (a) and an example irregular afferent (b) in each condition. c Population comparison of regular otolith canal afferent responses (n = 9). Neuronal modulations (top panel) and mean firing rates (bottom panel) were comparable across all conditions as shown by the slopes of the regressions (top panel; walking: p = 0.001, slope = 0.95, CI = ±0.27 and running: p =2.6 × 10⁻⁴, slope = 0.93, CI = ±0.35; bottom panel; walking: p = 0.03, slope = 1.01, CI = ±0.37; running: p = 0.05, slope = 1.07, CI = ±0.28; inset: ANOVA, F(2,16) = 0.45, p = 0.65 and F(2,16) = 2.7, p = 0.09 for the modulation and mean firing rate, respectively). d Population comparison of irregular otolith afferent responses (n = 14). Neuronal modulation was comparable during locomotion and passive stimulation (walking: p = 1.3 × 10⁻⁸, slope = 0.97, CI = ±0.13 and running: p = 4.0 × 10⁻⁶, slope = 0.92, CI = ±0.26, respectively; inset: ANOVA, F(2,26) = 1.03, p = 0.37). In contrast, mean firing rate was higher (gold arrow) during running compared to passive pitch and walking (walking: slope = 0.84, p = 0.001, CI = ±0.30; intercept = 14.6 sp/s, p = 0.49; running: slope = 0.77, p = 0.001, CI = ±0.30; intercept = 33.7 sp/s, p = 0.007; inset: ANOVA, F(2,26) = 6.0, p = 0.007). For all boxplots, the central mark indicates the median, the middle box indicates the 25th and 75th percentiles and the whiskers extend to the most extreme data points not considered outliers. Source data are provided as a Source Data file.

