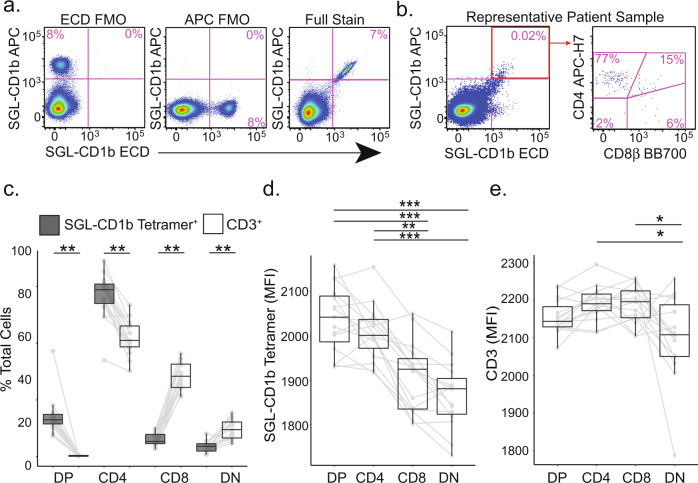
Fig. 1. Ex vivo co-receptor expression by SGL-specific T cells.
SGL-CD1b tetramers were incorporated into a multi-parameter flow cytometry assay to measure co-receptor expression by SGL-specific T cells. a The tetramer-positive gate was defined by a dual tetramer staining with electron coupled dye (ECD) and allophycocyanin (APC)) and ‘Fluorescence Minus One’ (FMO) negative control (left and center) and a positive control using SGL-specific T cell line (A05) diluted in donor PBMC (right). b Representative staining from a South African adolescent blood donor. c The co-receptor expression of SGL-CD1b tetramer-positive T cells in the blood was quantified using cryopreserved PBMC obtained from three groups of healthy participants: U.S. controls at low risk for M.tb exposure (n = 5), South African adolescents with latent tuberculosis (IGRA-positive, n = 5), and South African adolescents without latent tuberculosis (IGRA-negative, n = 5). Boxplots depict the minimum and maximum as the smallest and largest number of the dataset, excluding outliers, the median and interquartile range tetramer-positive cells (gray) within each co-receptor group (double positive (DP), CD4, CD8, and double negative (DN), expressed as a percent of total tetramer-positive cells. Each dot represents the percent of one individual, and solid lines connect each individual. The percent of cells in each group was compared to that present in total CD3+ T cells (white). (Two-sided Wilcoxon signed-rank test with Bonferroni Correction, ** = 0.003 or 0.004, n = 15). d Boxplots depict the minimum and maximum as the smallest and largest number of the dataset, excluding outliers, the median and interquartile range of mean fluorescence intensity (MFI) of SGL-CD1b tetramer-positive cells in each co-receptor group. Each dot represents the MFI of one sample, and solid lines connect each individual. MFI was compared between groups (Two-sided Friedman test with post hoc Dunn test, ***p < 0.0001, ** = 0.003, n = 15). e Boxplots depict the minimum and maximum as the smallest and largest number of the dataset, excluding outliers, the median and interquartile range of mean fluorescence intensity (MFI) of CD3 among tetramer-positive cells in each co-receptor group. Each dot represents the MFI of one sample, and solid lines connect each individual. MFI was compared between groups (Two-sided Friedman test with post hoc Dunn test, *p = 0.05, n = 15).

