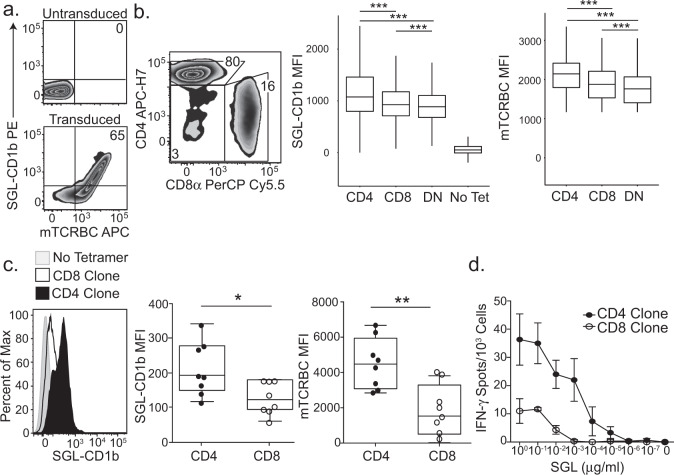
Fig. 2. Co-receptors enhance functional avidity of an SGL-specific TCR.
a Primary T cells were transduced with the TCR from the A05 T cell line using a lentiviral vector. Among primary T cells that are not transduced with the exogenous TCR, 0% stain with SGL-CD1b tetramers or a mTCRBC antibody (top). After transduction with the TCR, the cells stain with both the SGL-CD1b tetramer and mTCRBC antibody (bottom). b Flow plot depicts the percent of transduced T cells that are CD4, CD8, or DN. Boxplot depicts the median and interquartile range of the SGL-CD1b or mTCRBC MFI of each CD4, CD8, and DN T cell that was transduced with the A05 TCR (Two-way ANOVA, post hoc Dunn test, ***p < 0.0001, n = 86,520). Data are representative of two independent rounds of primary T cell transduction with the TCR of the A05 T cell line. c Single-cell clones were generated from the primary T cell transductants by limiting dilution cloning. A representative CD4 (black) and CD8 (white) T cell clone stained with SGL-CD1b tetramer is compared (left). A no tetramer control is also represented (gray) (left). Boxplots depict the minimum and maximum as the smallest and largest number of the dataset, excluding outliers, the median and interquartile range of SGL-CD1b MFI of CD4 (black) and CD8 (white) clones (Two-sided Mann–Whitney test, p = 0.019, n = 16). d Antigen-specific activation of CD4 (black) and CD8 (white) T cell clones was measured using IFN-γ ELISPOT. Error bars represent standard deviation and the center of the error bars is the mean of triplicate wells. SGL was serially diluted log-fold from 1 µg/ml to 10−7 µg/ml. Data are representative of two independent experiments.

