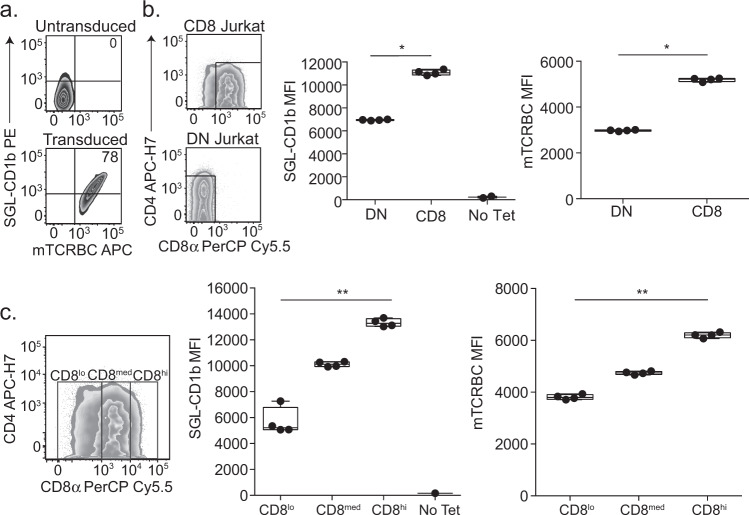
Fig. 3. CD8 is sufficient to enhance functional avidity of an SGL-specific TCR.
a DN and CD8 Jurkat cell lines were transduced with the TCR from the A05 T cell line. Untransduced CD8 Jurkat cells do not stain with SGL-CD1b tetramer or a murine T cell receptor chain constant region (mTCRBC) specific antibody (top). After transduction with the TCR, the cells stain with both the SGL-CD1b tetramer and mTCRBC antibody (bottom). b CD8 and DN Jurkat cells express a gradient of TCR co-receptor expression. Gates enclose true “CD8” (left, top) and “DN” (left, bottom) cells that express only CD8 or no co-receptors, respectively. Of note, the Jurkat cells that express CD8 display a gradient of expression, and the DN Jurkat cells exhibit low levels of CD4 co-receptor expression. The distributions of SGL-CD1b MFI of the DN and CD8 Jurkat cells were then compared (Two-sided Mann–Whitney, p = 0.03, n = 4). A no tetramer control is also represented (right). The distributions of mTCRBC MFI of the DN and CD8 Jurkat cells were also compared (right) (Mann–Whitney, p = 0.03, n = 4). Boxplots depict the minimum and maximum as the smallest and largest number of the dataset, excluding outliers, the median and interquartile range of MFI. c The distributions of SGL-CD1b MFI of CD8hi (MFI of 104–105), CD8med (MFI of 103–104), and CD8lo (MFI of 0–103) Jurkat cells were assessed (Two-sided Friedman Test with post hoc Dunn Test, p = 0.005, n = 3). The distributions of mTCRBC MFI of CD8hi, CD8med, and CD8lo Jurkat cells were then compared (right) (Two-sided Friedman Test with post hoc Dunn Test, p = 0.005, n = 3). Boxplots depict the minimum and maximum as the smallest and largest number of the dataset, excluding outliers, the median and interquartile range of fluorescence intensity. Data are representative of three independent experiments.

