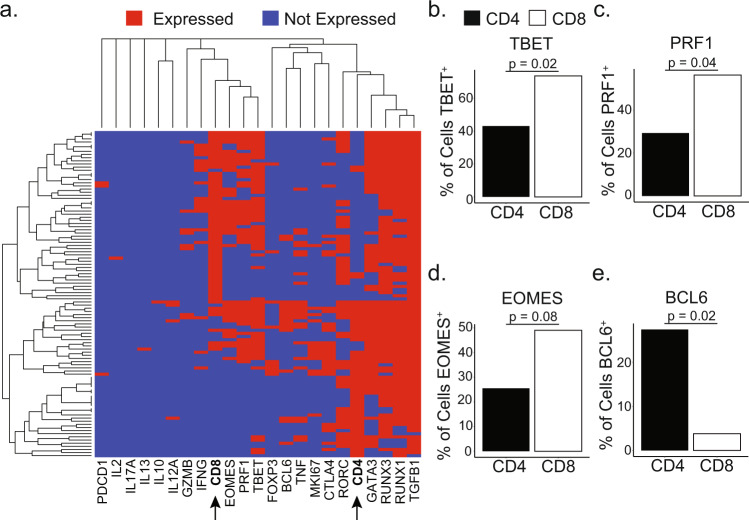
Fig. 4. Gene expression differences between ex vivo CD4 and CD8 CD1b-restricted T cells.
a Dendrograms on x and y axis summarize similarity between cells (y) or genes (x), where the distance is proportional to the level of dissimilarity. This relationship was computed with complete linkage hierarchical clustering using a binary distance metric. CD4 and CD8 genes on the X-axis have been bolded for emphasis. b–e Bar charts summarize the percentage of CD4 (black) and CD8 (white) T cells expressing TBET (b), PRF1 (c), EOMES (d), and BCL6 (e) (n = 104) (Two-sided Fisher’s exact test, Benjamini-Hochberg corrected). Summary of statistical tests is included in Supplementary Table 4.

