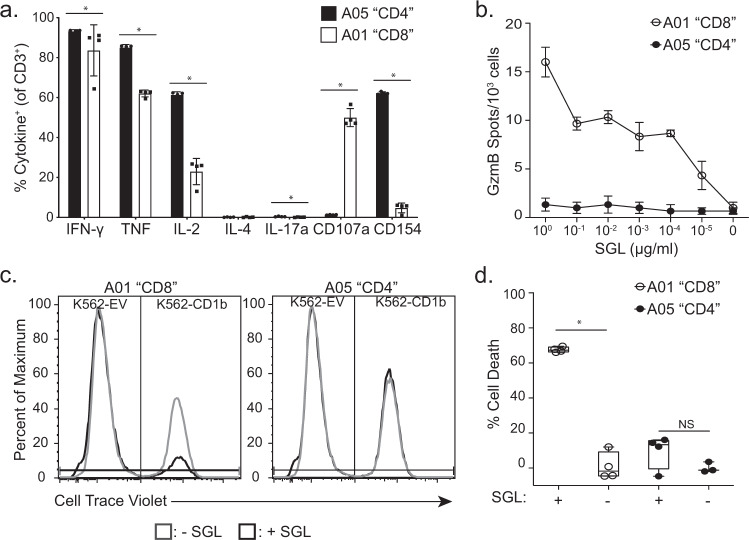
Fig. 5. Functional profiles of the A01 and A05 T cell lines.
a Cytokine production by the A01 (white) and A05 (black) T cell lines was measured using intracellular cytokine staining after co-incubation with K562-CD1b or K562-EV antigen-presenting cells and SGL antigen for 6 h. Data are expressed as a percent of T cells that express the cytokine as a percentage of total CD3+ T cells. Percentages are background corrected by subtracting the percentage of T cells that express cytokine after co-incubation with K562-EV antigen-presenting cells and SGL for 6 h. Error bars represent the mean and standard deviation of four technical replicates. Dots represent the value from one replicate. (*p = 0.03, Two-sided Mann–Whitney, n = 8). Data are representative of at least two independent experiments. b Granzyme B (GzmB) production from 1000 T cells from the A01 (white) and A05 (black) T cell lines after co-incubation with K562-CD1b antigen-presenting cells and SGL antigen. Cells were cultured overnight and GzmB production was assessed using GzmB ELISPOT. Antigen concentration ranged from 1 µg/ml to 10−5 µg/ml in log-fold dilutions. Error bars represent standard deviation and the center of the error bars is the mean of triplicate wells. Data are representative of two independent experiments. c Cytotoxicity was assayed by co-incubating A01 (left) and A05 (right) T cell lines with K562-EV and K562-CD1b antigen-presenting cells labeled “low” and “high” with Cell Trace Violet, respectively. Co-cultures were incubated in the presence (black) or absence (gray) of SGL antigen. We defined specific lysis as the ability of a T cell line to specifically reduce the K562-CD1b cell population in the presence of lipid, while leaving the K562-EV population and the K562-CD1b without pulsed antigen intact after co-incubation. d Cytotoxicity was quantified by calculating the percent of cell number reduction of K562-CD1b cells in the experimental conditions compared to the percentage of K562-CD1b cells in culture in a condition with no T cells and no lipid antigen (Supplementary Fig. 7) (% Cell Death). Percentages were calculated for the A01 (white) and A05 (black) T cell lines in the presence or absence of SGL. Error bars represent the mean and standard deviation of four technical replicates (*p = 0.03, Two-sided Mann–Whitney, n = 8). Boxplots depict the minimum and maximum as the smallest and largest number of the dataset, excluding outliers, the median and interquartile range of % Cell Death measurements. Data are representative of at least two independent experiments.

