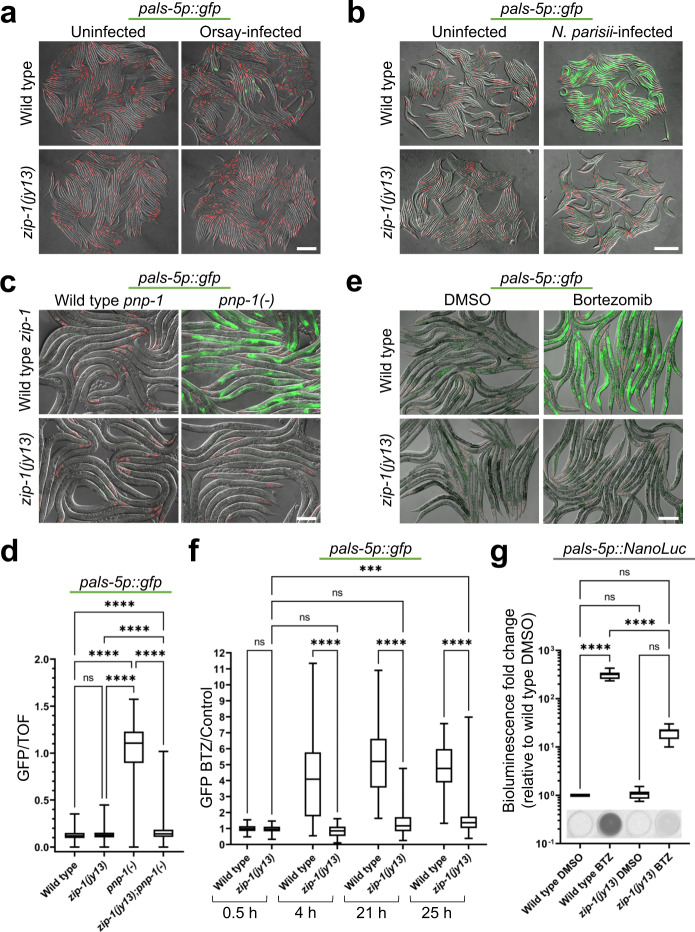
Fig. 2. zip-1 is required for induction of pals-5p::GFP expression by intracellular infections, pnp-1 downregulation, and proteasome blockade.
a, b Intracellular infection by Orsay virus (a) and by N. parisii (b) leads to pals-5p::GFP expression in wild-type animals, but not in zip-1(jy13) mutants. c pnp-1(jy90) mutants show constitutive expression of the pals-5p::GFP reporter, which is suppressed in zip-1(jy13); pnp-1(jy90) double mutants. d Box-and-whisker plot of pals-5p::GFP expression normalized to length of animals (TOF). Increased GFP signal in pnp-1(jy90) mutants is significantly reduced in zip-1(jy13); pnp-1(jy90) double mutants. Three experimental replicates with 400 animals per replicate were analyzed for each strain. e Bortezomib treatment induces expression of pals-5p::GFP in a wild-type background, but not in zip-1(jy13) mutants. a–c, e Three independent experimental replicates were performed with similar results. Fluorescent and DIC images were merged. Scale bars = 200 µm. myo-2p::mCherry is expressed in the pharynx and is a marker for the presence of the jyIs8 transgene. f Timecourse analysis of pals-5p::GFP expression in control and zip-1(jy13) strains following bortezomib treatment. GFP signal normalized to worm area is shown as a fluorescence intensity ratio between bortezomib- and DMSO-treated samples (y-axis). Three experimental replicates with 30 animals per replicate were analyzed; average value was used for DMSO controls. Allele names and timepoints of analysis are indicated on the x-axis. g Expression of the pals-5p::NanoLuc reporter is significantly lower in zip-1(jy13) animals than in the wild-type control strain, following bortezomib treatment. Three experimental replicates consisting of three biological replicates were analyzed for each strain and treatment. Results were normalized to background luminescence and to average value of three biological replicates for wild-type treated with DMSO. Normalized relative luminescent units (RLU) are shown on the y-axis. Images of bioluminescent signal in representative analyzed wells are shown on the bottom of the graph. d, f, g In box-and-whisker plots, the line in the box represents the median value, box bounds indicate the 25th and 75th percentiles, and whiskers extend from the box bounds to the minimum and maximum values. A Kruskal–Wallis test (d, f) or ordinary one-way ANOVA test (g) were used to calculate p-values; ****p < 0.0001; ***p < 0.001; ns indicates nonsignificant difference (p > 0.05). p-values in d for WT vs zip-1(jy13) p = 0.3552, other comparisons p < 0.0001. p-values in f for WT vs zip-1(jy13) at 0.5 h p > 0.9999; WT vs zip-1(jy13) at 4, 21 and 25 h p < 0.0001; zip-1(jy13) 0.5 h vs zip-1(jy13) 4 h p > 0.9999; zip-1(jy13) 0.5 h vs zip-1(jy13) 21 h p = 0.1093; zip-1(jy13) 0.5 h vs zip-1(jy13) 25 h p = 0.0004. p-values in g for WT DMSO vs WT BTZ p < 0.0001; WT DMSO vs zip-1(jy13) DMSO p > 0.9999; WT DMSO vs zip-1(jy13) BTZ p = 0.5576; WT BTZ vs zip-1(jy13) BTZ p < 0.0001; zip-1(jy13) DMSO vs zip-1(jy13) BTZ p = 0.5601. Source data are provided as a Source Data file.

