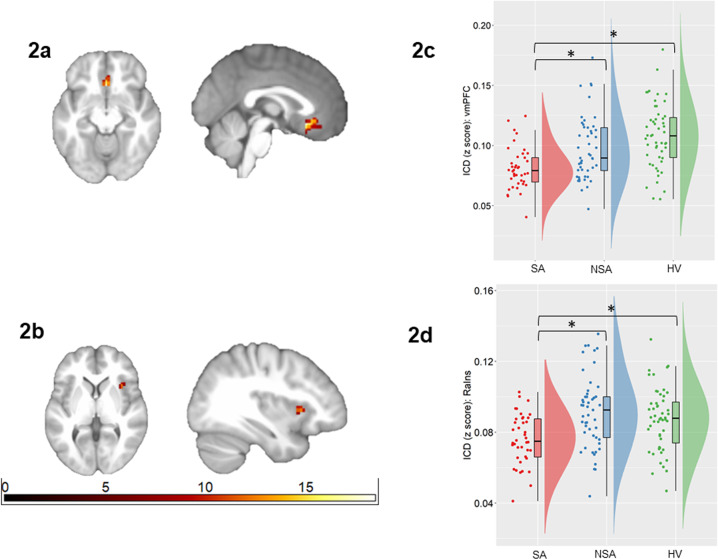
Fig. 2. Alterations in intrinsic connectivity distribution associated with suicide attempts in bipolar disorder.
The axial and sagittal images show regions of differences in intrinsic connectivity distribution from an ANCOVA analysis comparing individuals with bipolar disorder with history of suicide attempts (SA group; n = 40), individuals with bipolar disorder without suicide attempts (NSA group; n = 49), and healthy volunteers (HV; n = 51), in bilateral ventromedial prefrontal cortex (vmPFC; Fig. 2a) and right anterior insula (RaIns; Fig. 2b) (p < 0.05, corrected for family-wise error). Left of the figure denotes left side of brain. The color bar represents the range of F values. The raincloud plot [63] of distribution of extracted z-values from the vmPFC (Fig. 2c) and the RaIns (Fig. 2d) show the group differences resulted from lower ICD in these regions in the SA group compared to the NSA and HV groups (*p < 0.05, corrected for 3 pair-wise group comparisons).

