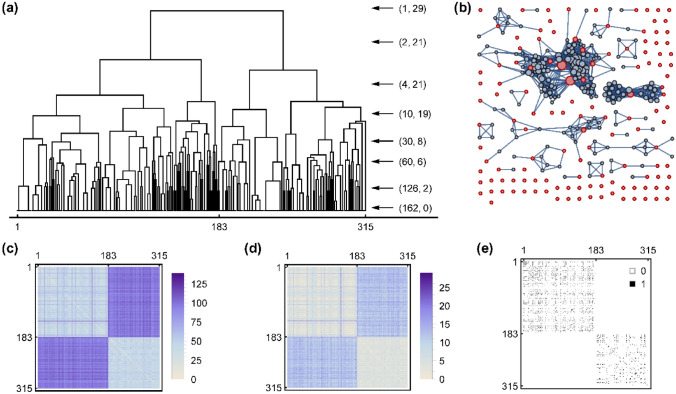
Figure 2.
(a) Hierarchical clustering of curated receptor ensemble based on dissimilarity matrix . For better presentation a logarithmic scale was used vertically. The arrows point to some possible levels of dendrogram truncation for which the first number in parenthesis is the number of clusters and the second one is the maximum intra-cluster dissimilarity. (b) Redundancy graph of curated receptor ensemble. Nodes are receptors scaled by their centrality and edges are redundancies ( or ). Red nodes are 126 members of non-redundant receptor ensemble selected via an iterative centrality-based procedure. (c) Dissimilarity matrix . (d) Dissimilarity matrix . (e) Adjacency matrix . In all plots, the first 183 receptors are without cyclin.

