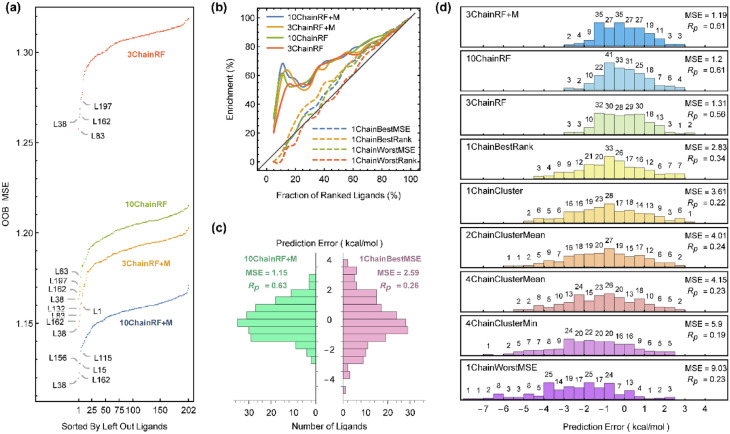
Figure 7.
(a) OOB MSE for each of the leave-one-out models corresponding to forests created from docking features of 3 and 10 most important receptors with or without 8 molecular features. The most difficult ligands to predict are labeled. (b) The enrichment rate of RF models compared to the most and the least accurate docking strategies. (c) Distribution of prediction errors of the most accurate RF model in comparison with the most accurate docking without learning strategy. (d) Distribution of prediction errors compared for some representative models and their MSE and Pearson’s correlation coefficient between predicted and experimental values.

