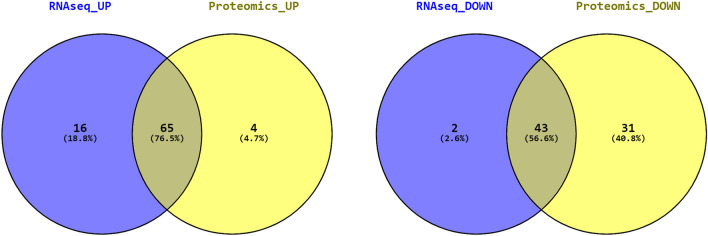
Figure 5.
Comparative analysis of main diseases and biofunctions associated with differentially expressed genes and proteins. Comparative analysis of main diseases and biofunctions associated with upregulated and downregulated genes and proteins in response to intense training. Venn diagrams were generated based on the IPA Disease and Biofunction results derived from the upregulated (left panel) and downregulated (right panel) transcriptomic and proteomic datasets.

