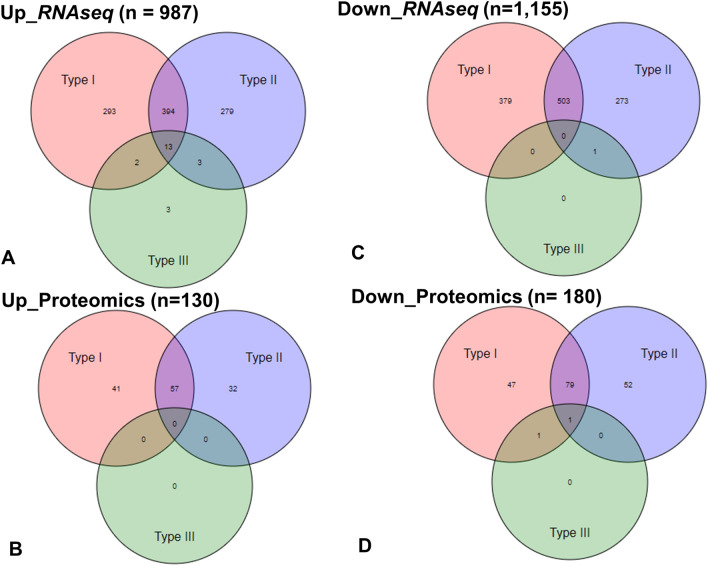
Figure 6.
Venn diagram of genes and proteins regulated by IFN types. The Venn diagram shows the number of genes or proteins regulated by one or more IFN type (Type I, II or III). Venn diagrams were generated based on the upregulated genes (A), proteins (B) and the downregulated genes (C), proteins (D) during the training period (interferome database). Note there are very few datasets for type III interferons—only twenty datasets from just two human experiments; thus any interpretation of type III interferons should be done with caution (http://www.interferome.org/interferome/home.jspx).

