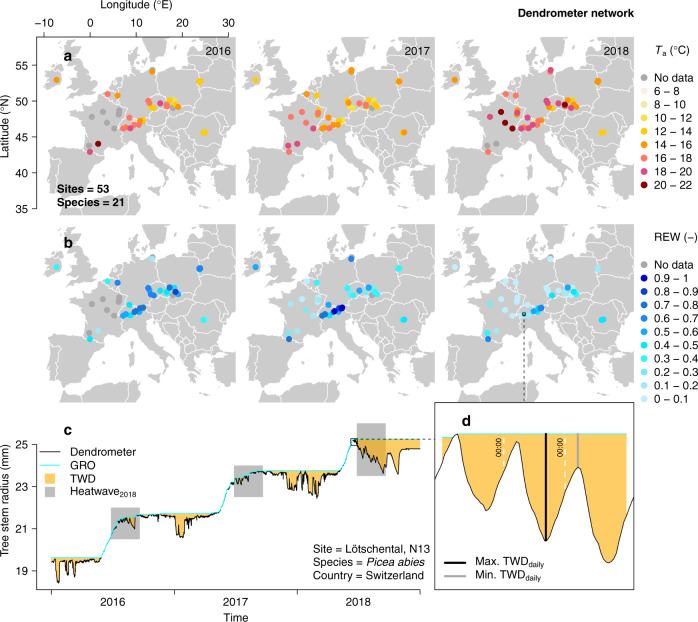
Fig. 1. Climatic conditions during the 2018 heatwave period and dendrometer network.
a, b Spatial distribution of dendrometer sites and their respective mean atmospheric temperature (Ta in °C) and relative extractable water (REW) during the 2018 heatwave timeframe (day of year 208 until 264) for 2016–2018. Sites with incomplete dendrometer time series data are indicated with grey dots. c Tree stem radius monitored at the Swiss Lötschental (site N13) for a Picea abies (L.) Karst. tree. The period corresponding to the 2018 heatwave is shown in all three years (defined as Heatwave2018), in addition to tree water deficit (TWD) and extracted growth (GRO). d Inset of three days of tree stem radius monitored for the P. abies tree, where the concept of daily minimum and maximum TWD is shown (Max. TWDdaily and Min. TWDdaily, respectively).

